User story mapping in SAFe and PI Planning
New to story mapping? Start with our complete User Story Mapping Guide.
When we first published this post in September 2019, it said that SAFe doesn’t talk about user story mapping. That was true at the time. People kept asking us where a story map fits in the Scaled Agile Framework, and the honest answer was that the framework hadn’t said.
It has now. SAFe’s glossary defines a Story Map as a design thinking technique that organizes stories by the tasks a user performs to reach a goal. SAFe 6.0 also renamed the thing this post was mostly about. The Program Increment is now the Planning Interval. The acronym survived, which was considerate of it.
So the useful question now is where in the cadence a map does the most good. We think there are two places, and the first is the big one.
SAFe in one paragraph
SAFe is a set of practices for running agile and lean development across many teams at once. Teams are grouped into Agile Release Trains (ARTs) that plan together every Planning Interval, usually 8 to 12 weeks, at an event called PI Planning. Work flows down from portfolio epics to features on the ART Backlog, and from features to stories on each team’s backlog. The aim is shorter cycle times and less coordination pain at a scale where a single Scrum team’s habits stop working on their own.
At PI Planning, bring a map instead of a list
PI Planning is where the train decides what it’s building for the next interval and commits to objectives. Every team needs to understand what they’re building and why, and they need to understand it fast, because PI Planning usually runs two days and everyone is in the same room or the same call.
The usual input is a ranked backlog of features. A backlog is a fine list and a poor story. Ranked features tell a team what matters most. They don’t show how those features connect into something a user does from start to finish, which is exactly what a team needs to know when it breaks features into stories and finds its dependencies on other teams.
So bring a story map instead, or alongside it. Here’s a small one.
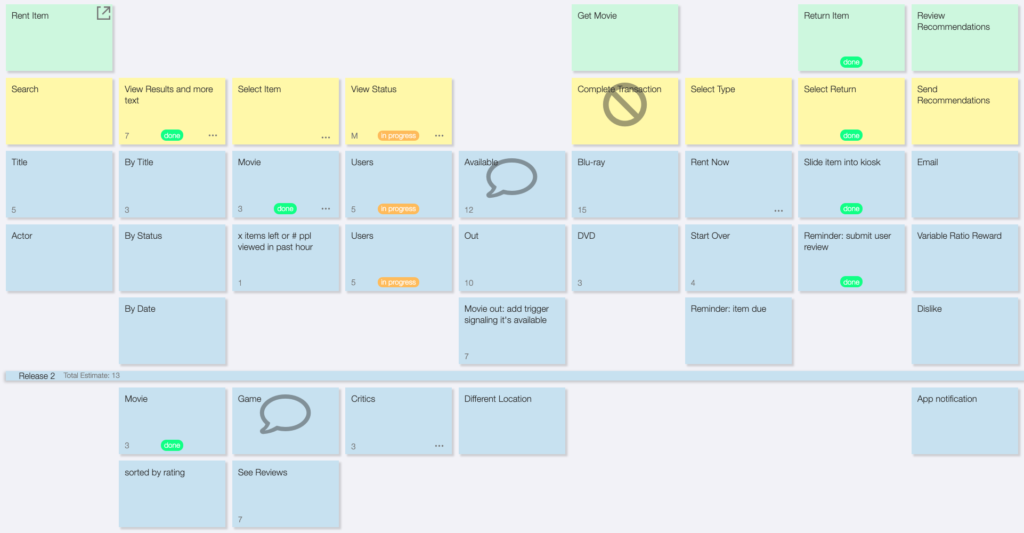
The backbone reads left to right as what a customer does at the kiosk. Rent an item, get the movie, return it, review recommendations. Under each step sit the stories that make it work. A team looking at this in PI Planning can see which features belong to which part of the customer’s path, and where two teams’ work has to meet.
The line across the map is a cut line. Everything above it is committed for this Planning Interval, and everything below waits for a later one. Moving a story across that line in the middle of PI Planning is a visible act. Everyone in the room can see what it does to the rest of the row.
A few other artifacts are worth having ready before PI Planning, especially for a new product or a big shift in direction. A Business Model Canvas covers the business case. An Opportunity Canvas covers the problem you’re solving. An empathy map covers who you’re solving it for. CardBoard has map types for all three.
Before each iteration, map one level down
SAFe teams work in iterations, usually two weeks, inside the Planning Interval. Before an iteration starts, the Product Owner and the team can map the features they’ve pulled in at a finer grain. This is where features break into stories and stories break into tasks, and the map keeps that breakdown tied to the part of the user’s path it serves.
When the map is done, its stories feed the team backlog or a Kanban board as usual. Before they go, the team can write acceptance criteria on each card, so testing is planned before the building starts.
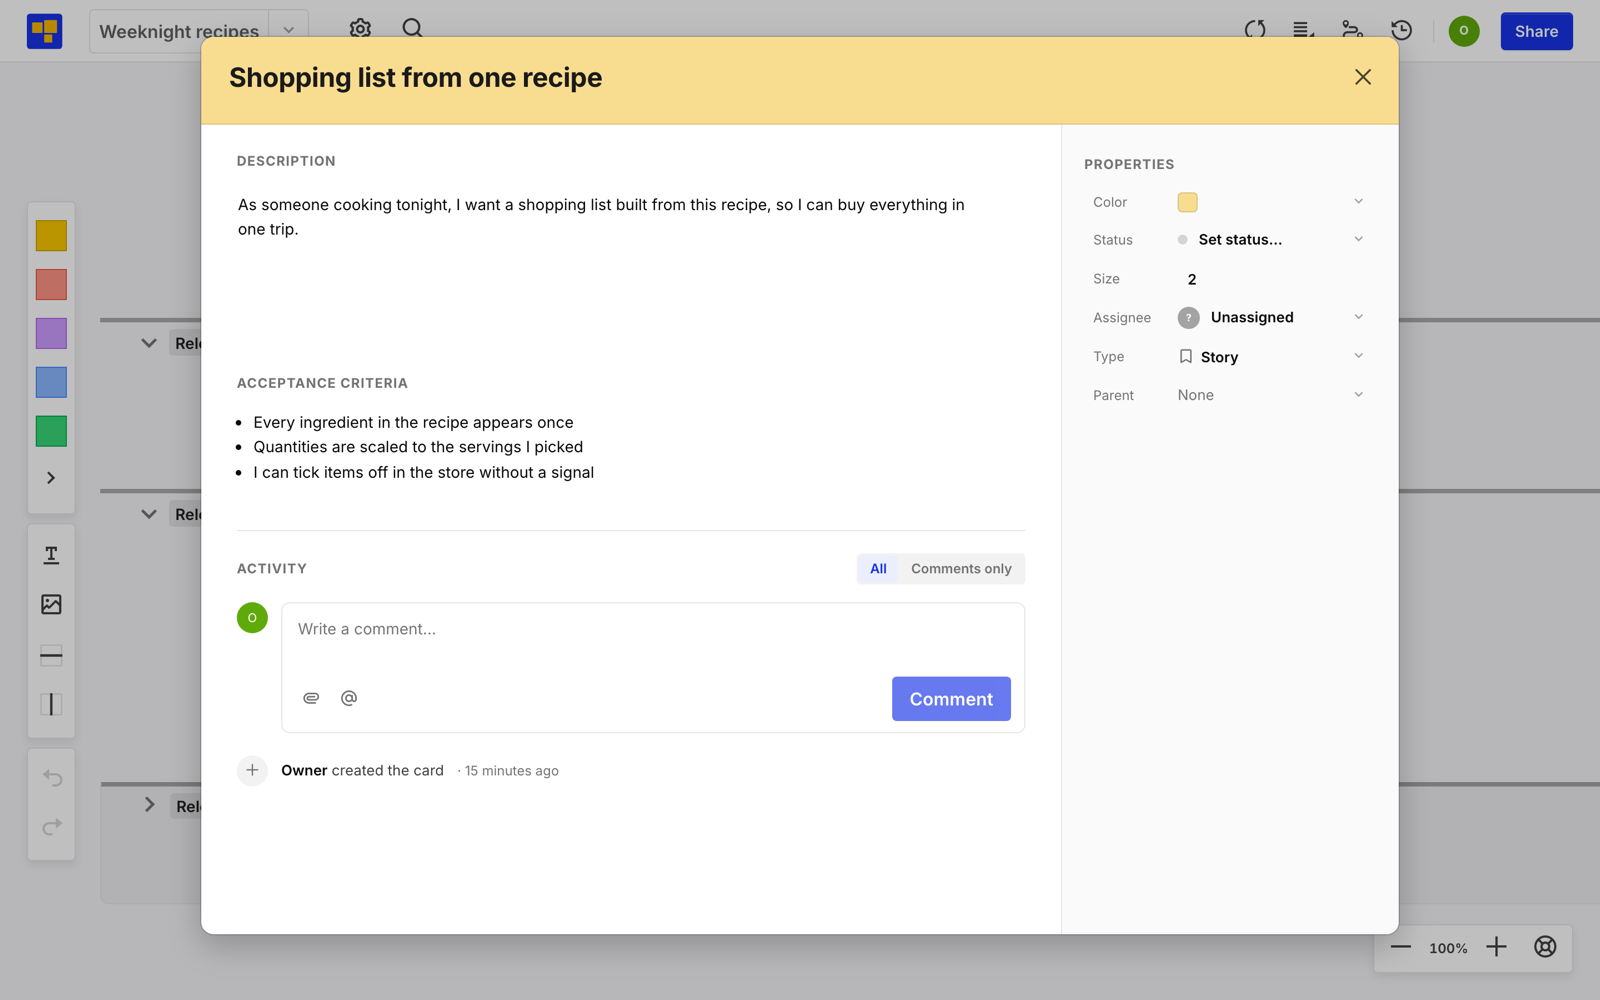
What this looks like in CardBoard today
A lot has changed in CardBoard since this post first ran. A map built for PI Planning now lives on a user story map board, with dividers as the cut lines between Planning Intervals or releases. Acceptance criteria have their own field on each card. Connect the board to Jira or Azure DevOps and the cards link to work items, with title, status, description, acceptance criteria, parent, and assignee syncing in both directions. The ART and team backlogs stay in the tracker, where SAFe expects them. The map keeps the picture of what the user does, which is the part a ranked list was never going to hold.
For how to run the mapping session itself, see how to facilitate a user story mapping session.
Didn’t find what you need? Visit our Help Center to find answers or get in contact with our team.
Ready to try CardBoard for yourself? Create a free account, three boards, no credit card.