When will it be done? Software estimation for product managers
In 2020, Daniel Vacanti published a whole book with this post’s title on the cover, When Will It Be Done? The subtitle calls it your customers’ most important question.
He’s right about that. It’s also the question product managers answer worst, and not for lack of practice. We get asked it weekly and we answer it weekly. We are wrong on a fairly reliable schedule, which is at least a kind of predictability.
Here’s one of mine. At CardBoard, one engineer estimated six months to refactor our tracker integrations. Standing up Azure DevOps on the new structure took 60 days. The full refactor, breaking the app into Packwerk packs (a Rails tool for carving a codebase into modules), took a year.
So the estimate was wrong in both directions at once. The part we could see was faster than the guess, and the whole thing took twice as long. A single number had no way to say both.
The usual fix is to get better at estimating, with more detail up front and tighter planning poker. I think that aims at the wrong target. The most useful thing an estimate does is record what you assumed. When it turns out wrong, it points straight at what you didn’t know, and a story map will show you most of those gaps before the schedule does.
Past performance does not guarantee future features
Estimation in software is usually treated like a science. Gather the data and predict from past performance. It’s logical, and it rests on the assumption that the next thing will look like the last thing.
When we estimate a new feature, we reach for something similar we built before. “Feature X took two weeks, so Feature Y should too.” Reasonable enough, until Feature Y turns out to have its own surprises.
Take a login feature. We’ve built one before, it took a week, so we estimate a week. This time we’re integrating with a third-party authentication service we’ve never used, and its API documentation is out of date. We lose days figuring it out, and the one-sprint estimate becomes two.
Nobody did anything wrong. The estimate assumed we knew the auth service, and we didn’t. The schedule found out before we did.
That’s the trap. Traditional estimation assumes a familiarity that rarely exists when you’re building something new. If we knew exactly how long it would take, we’d be retracing our steps.
What story points and story counts are each good for
Teams usually reach for one of two methods, both in the name of accuracy.
Story points measure effort. The team gives each user story a point value based on how complex it seems, and hopes the values get more consistent over time. The catch is that points are subjective. One person’s 5 is another’s 3, and even when the team agrees, a 5 this sprint won’t take the same time as a 5 next sprint.
Counting stories skips the points. The team counts how many stories it finishes per sprint and uses that velocity to predict the future. The catch here is that stories aren’t all the same size. Some take an afternoon and some take a week.
Here’s the judgment call. Both methods are bad at predicting any single feature. Counts get much better when you forecast a whole project, because across dozens of stories the big and small ones mostly cancel out. That’s why I’m happy to forecast a release from a card count with Monte Carlo simulation, and why I walk through exactly that in Hate estimating? Forecast from a user story map instead.
Neither method tells you why a particular story blew up. For that you have to look at what you assumed.
Treat every estimate as a hypothesis
New features are uncharted, so predicting them exactly is a fool’s errand. That doesn’t make the estimate worthless. It makes it a guess you can check.
Every estimate rests on assumptions, mostly that we understand the requirements and know how to build the thing. Those assumptions break all the time, and the moment one breaks is when you learn the most.
Say we estimate a feature at two weeks, then hit a technical problem nobody saw coming, and it takes three. The extra week tells us there was something about this part of the system we didn’t understand. Now we do.
Patterns matter more than single misses. If estimates in one area are consistently off, there’s a gap there. Maybe the requirements are fuzzy, or part of the stack is unfamiliar. The misses point right at it.
To carry that uncertainty in the estimate itself, give a range instead of a number. “Two to four weeks, and I’m about 70% confident” is more honest than “three weeks.” The width of the range tells people how much you don’t know yet, which is exactly what they need to plan around.
A story map shows you where the unknowns live
A user story map lays the steps a user takes across the top and the stories that support each step underneath. You get the full scope in one picture, which gives you something to estimate from. It also does something a backlog can’t.
Every story on the map is an assumption about what the user needs and how we’ll build it. Once the stories are laid out in the order a user meets them, the gaps show. You’ll find a step with nothing under it, or a second kind of user whose path splits off halfway through.
Those gaps are where the estimate is going to be wrong. Better to find them on the map than in sprint seven.
When you find one, flag it and put a spike in the backlog, a time-boxed piece of research that produces understanding instead of code. A spike won’t shrink the work. What it shrinks is the part of the estimate you made up.
Flag the risk by color
Here’s how this plays out. The team below is illustrative, not a customer story, but every step is one you can run next sprint.
A team building a B2B back-end product needs a feature for processing bulk orders. Part of it integrates with an external inventory system nobody on the team has used.
- Map it. They lay out the ordering flow as a story map and break each step into stories.
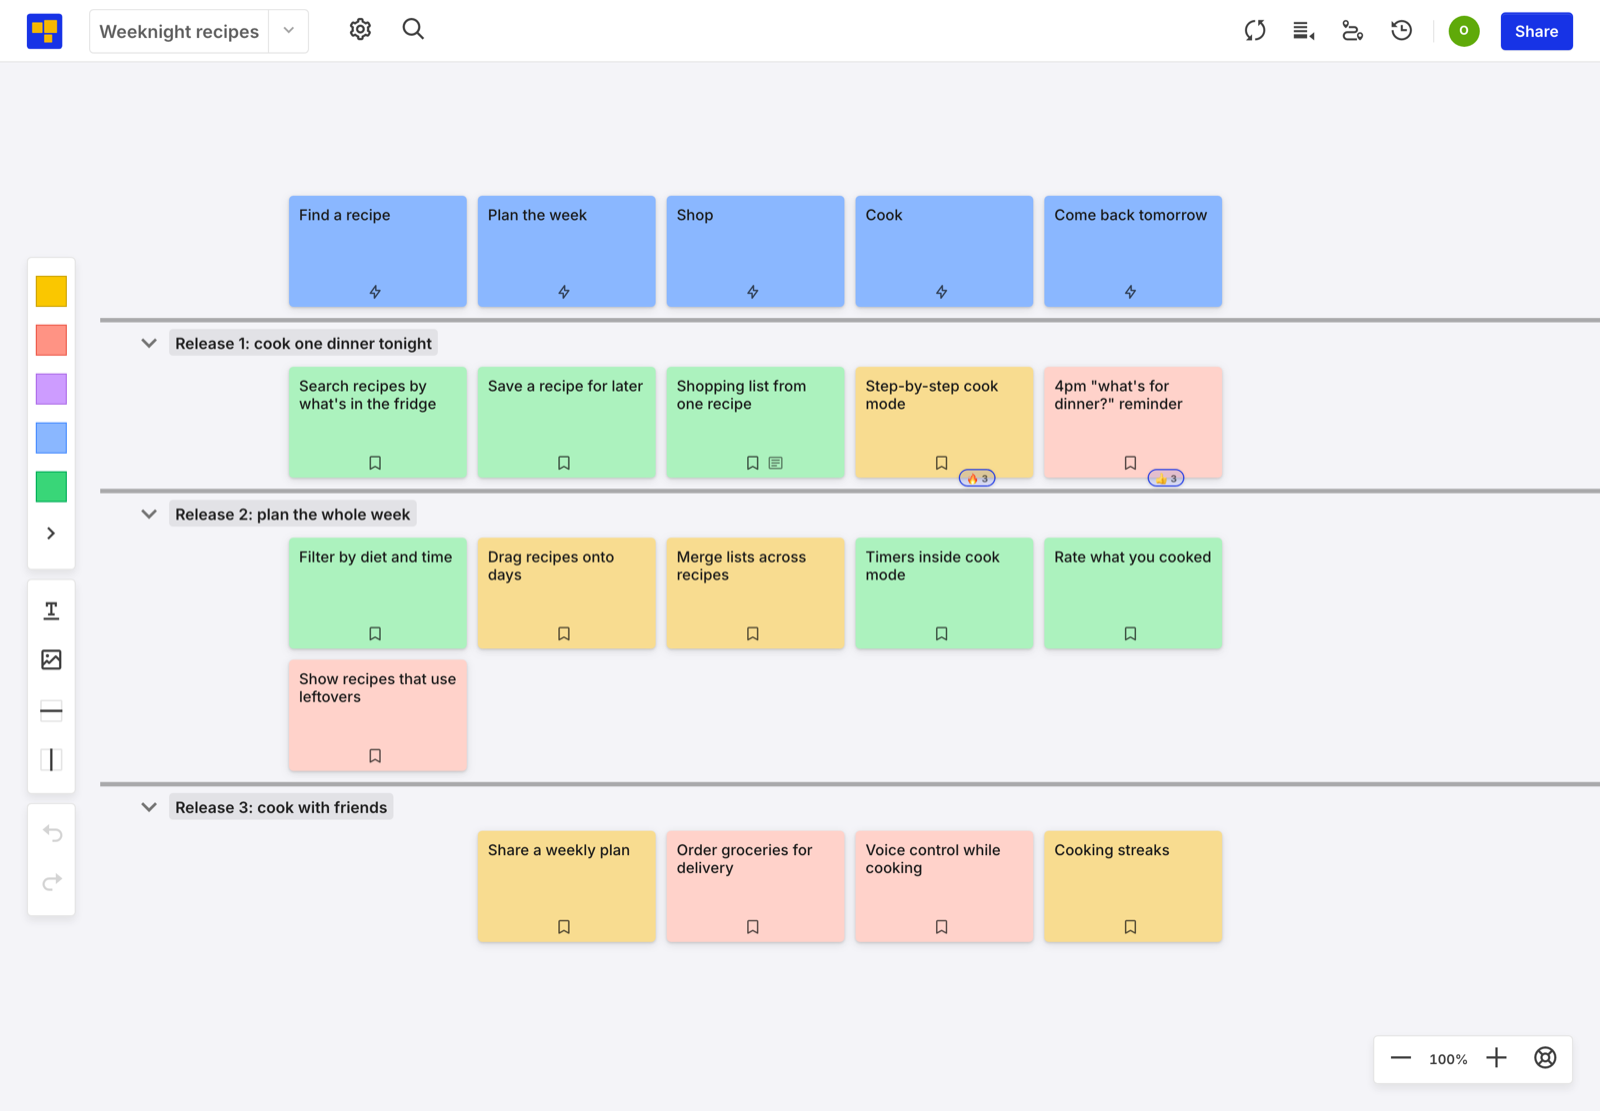
- Flag each story by risk. Green means well understood, yellow means some unknowns, red means many. The inventory integration goes red immediately.
- Estimate, and write down the assumption. Each estimate gets a one-line note on what it assumes, especially on the yellow and red cards.
- Track estimate against actual. As work lands, green stories come in close. Yellow and red ones miss, and they miss in the same direction.
- Retro on the misses, not the people. What made this harder than we thought? What did we assume that wasn’t true?
- Change the process. By now the pattern is obvious. New integrations and unfamiliar technology are where their estimates break, so those stories get a spike before they get an estimate, and more room in the plan.
The team still misses estimates after all this. What changes is that they know which ones to trust.
In CardBoard, the traffic lights can simply be card colors on the story map, so the red cards are visible from across the room. A reaction or a comment on a card works for “we don’t understand this yet,” and a spike is just another card under the step it’s investigating.
Answering the question in the title
Nobody will stop asking when it will be done. When they ask, answer with a range and your confidence in it, and update both as the map changes. Keep the retro on the misses going, because that’s where the next estimate gets better.
You’ll still be wrong sometimes. Aim to be wrong a little less often, and to learn something every time you are.
Ready to try CardBoard for yourself? Create a free account, three boards, no credit card.