Hate estimating? Forecast from a user story map instead
New to story mapping? Start with our complete User Story Mapping Guide.
Someone asks how long it will take. You say “maybe three months?” with a question mark you can hear, and they write down “three months.” The question mark does not make it into the notes.
Six weeks later it’s a deadline.
Business folks want certainty, and that’s fair, since they have a budget and a boss. Engineers have been burned so many times that we’ve stopped guessing out loud, because the guess always comes back as a commitment. I see both sides. For years I just hated the whole exchange.
Then I stopped estimating and started forecasting, from a user story map. It turned something I despised into something I rather enjoy. Here’s the process, step by step, including the part where I assume every story is the same size and it works anyway.
1. Have the conversation, even if there’s a document
Start by talking to whoever wants the thing built. Ask as many questions as you can about their goals and what they expect the product to do. Sometimes a requirements document lands in your lap. That’s fine. Read it, then have the conversation anyway.
We aren’t after the gory details yet. It’s completely fine for parts of the work to be undefined or uncertain. The forecast makes room for that in step 4.
2. Build a user story map
This is where it gets fun.
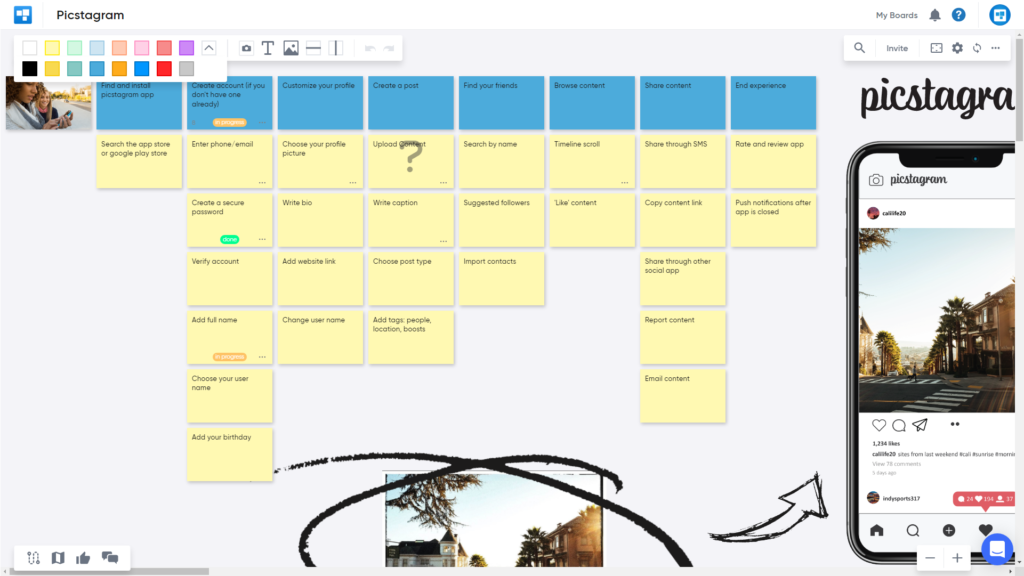
I love building user story maps because I think in pictures. After the conversation, we lay out the work in CardBoard: the steps a user takes run across the top as the backbone, and the stories that make each step real sit underneath.
The goal is to break the problem into manageable pieces without drowning in detail. We make sure every screen that needs building is on the map, along with anything important that isn’t UI, like the data migration or the report finance needs every Friday.
At the end you have a shared picture of what’s needed. You’ve also missed things. Everyone does, and the forecast has a place for that too.
3. Count the cards
Most teams size broken-down work in hours, days, or story points. I like two options better.
T-shirt sizing gives each story a size from a small set, say S, M, L, and XL, by comparing it to the others. There’s no arithmetic, only “bigger than that one.”
Counting is simpler still. Assume every story is roughly the same size and count them.
Counts are my favorite, and yes, it sounds crazy. There’s obviously variance between stories. I thought the same thing. But once work is broken into pieces the team understands, most stories land close to a typical size, and the big and small ones mostly cancel out across a whole project. The forecast in the next step cares a lot more about how many things there are than about how precisely you sized each one.
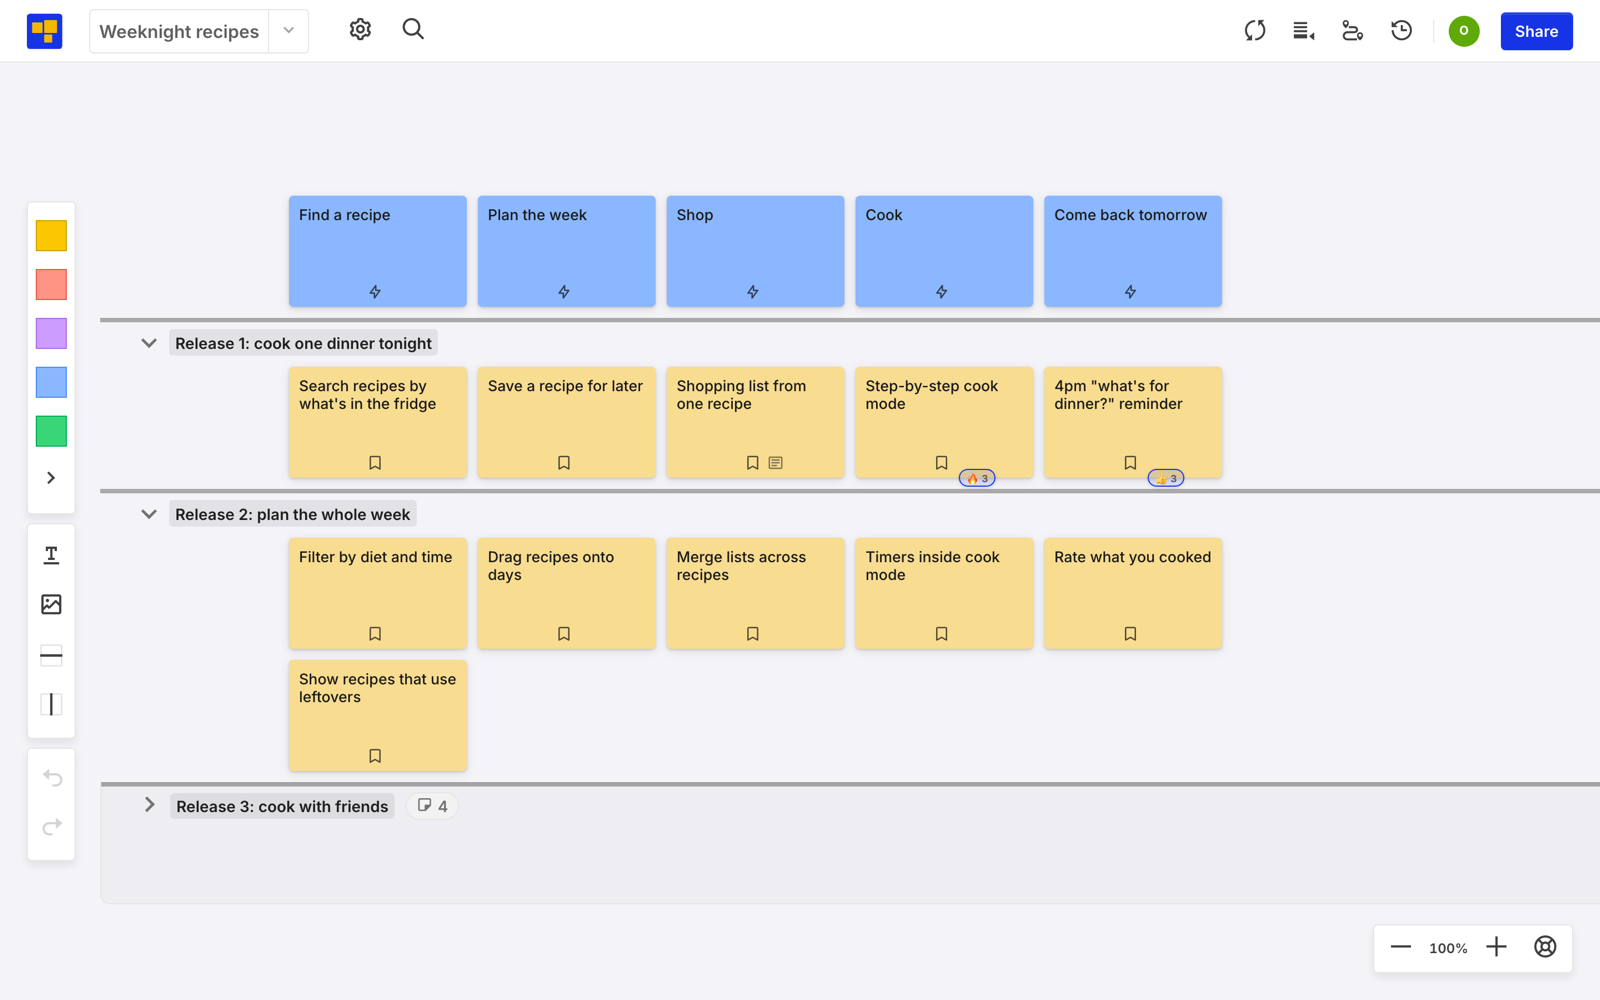
In CardBoard, each release slice on a story map is a divider across the map. Collapse a slice and it shows how many cards are inside it. That number is your count. If your team prefers T-shirt sizes, every card also has an optional Size field.
4. Forecast it with Monte Carlo
The best part of this process is a free forecasting spreadsheet built by Troy Magennis, the Multiple Feature Cut Line Forecaster. It’s still free on GitHub.
The tool uses Monte Carlo simulation. It plays the project out hundreds of times, with slightly different luck each time, and reports the range of dates you might finish along with the likelihood of each one. The likelihood is the part that matters. (For how the simulation itself works, and a worked example you can check by hand, see Monte Carlo forecasting for software project estimation.)
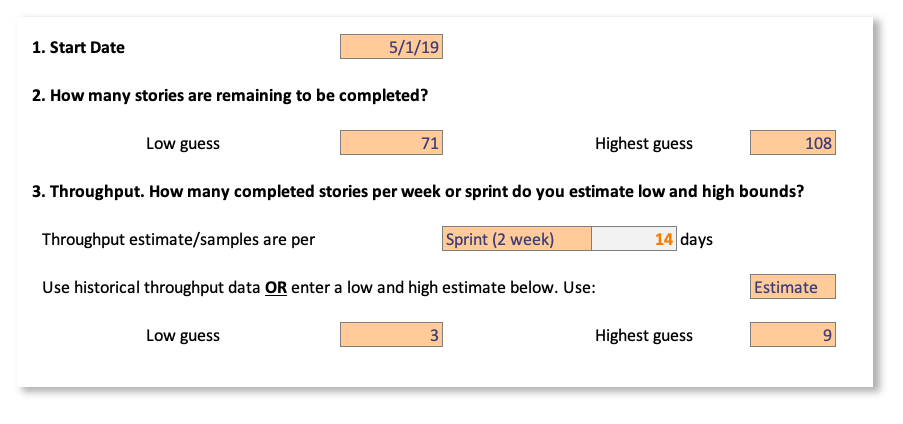
On the Forecast tab, enter:
- Start date, when you expect to begin
- Low guess for story count (I use the number of cards on my story map)
- High guess for story count, which is that count plus room for rework, bugs, and scope we haven’t found yet
- Sprint length in days
- Low guess for stories per sprint, what the team finishes in a slow sprint
- High guess for stories per sprint, what it finishes in a good one
The judgment calls are the two high guesses. The high story count is where you’re honest about what you missed in step 2. The high throughput is where you’re honest about your best sprint, not your best week of your best sprint.
The screenshots below are from 2019, when I first wrote this up. The dates are old. The arithmetic isn’t.
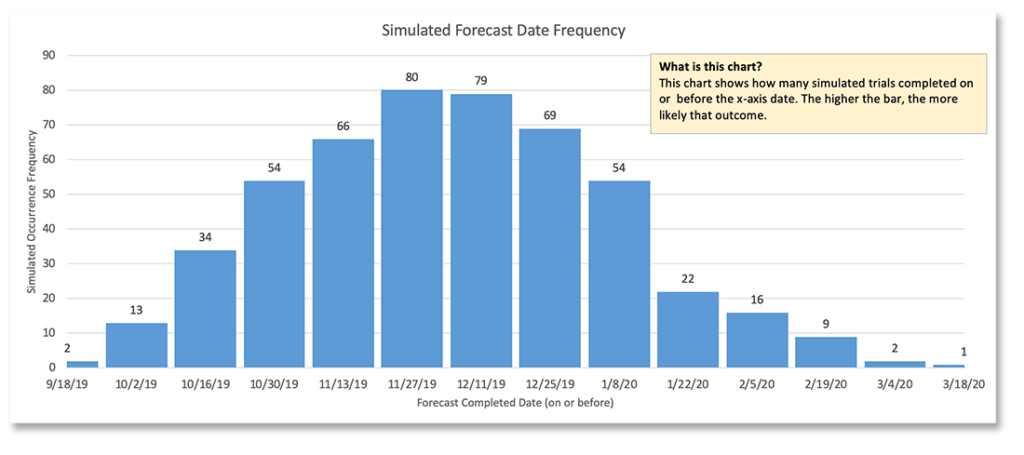
With those inputs, the tool runs 500 simulations of the project and collects the finish dates. The histogram shows how many simulations finished on each date. For example, 80 of them finished on November 27, 2019.
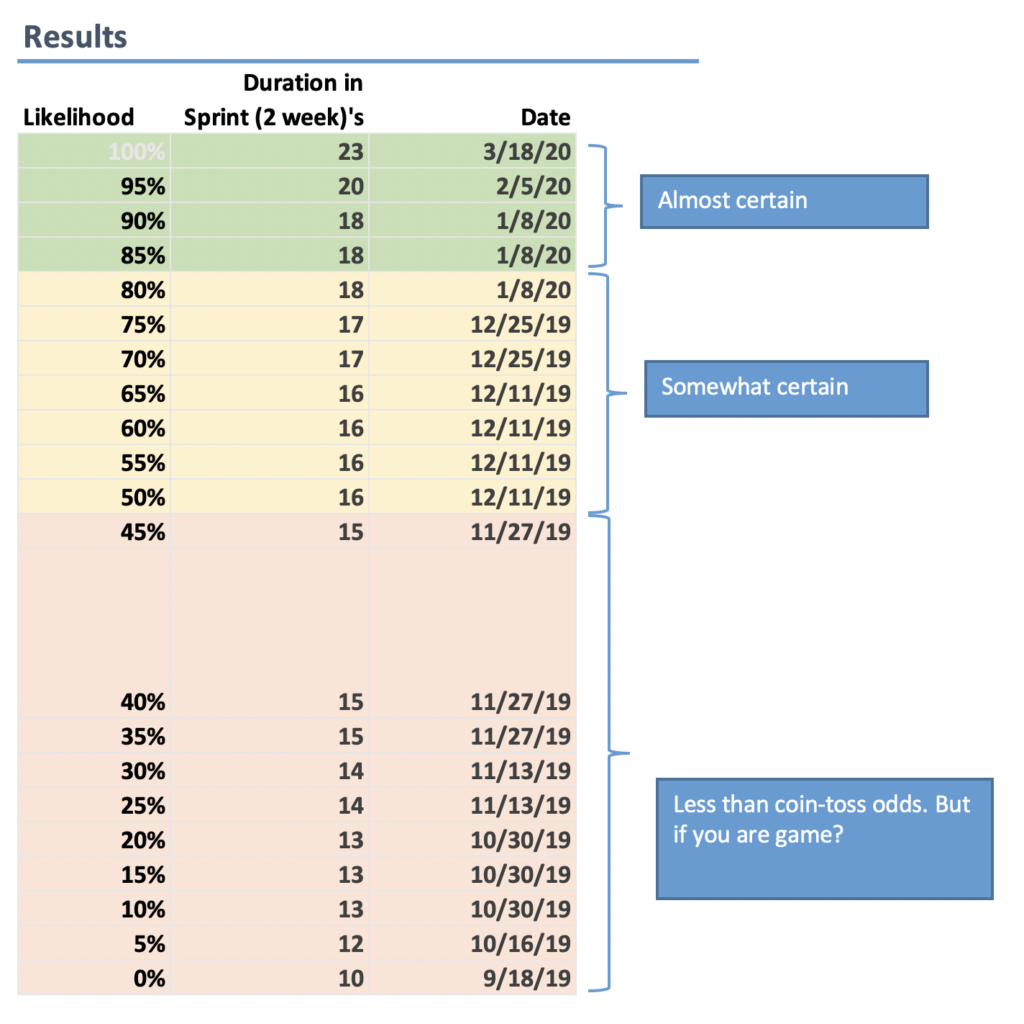
The other view is a table of likelihoods: the odds of finishing by each date. When someone asks “when will you be finished?”, this table is what I bring to the conversation.
5. Hand over a range
What I communicate is a range of dates. I rarely quote anything below 50%, which is only safe when a project is small and has no dependencies. That describes almost no project anyone has ever asked me to estimate.
Most projects land somewhere in the 50% to 90% band, and that’s what I budget and plan against. I lean conservative, because something always goes sideways in software development. The forecast already expects it. When it happens we adapt and move on, instead of renegotiating a promise.
6. Forecast again when the map changes
People will not stop asking “when is it going to be done?” During the project they’ll also want to know how every change and every piece of unplanned work moves the date. This is the part I like most. Update the story map as you learn, recount the cards, feed the new numbers into the spreadsheet, and the forecast moves with you.
Weather forecasts change every day and nobody calls the meteorologist a liar. Software forecasts deserve the same treatment. Skip the single date at the start of the project. Give a range, and keep people posted as it moves.
What to do with the estimates themselves, besides promise them, is its own post: When will it be done? Software estimation for product managers.
Ready to try CardBoard for yourself? Create a free account, three boards, no credit card.
Didn’t find what you need? Visit our Help Center to find answers or get in contact with our team.