How to pick the product metrics that matter
In 2007, an investor named Dave McClure gave a talk called Startup Metrics for Pirates. He’d watched too many founders report page views and follower counts, numbers that went up and to the right while the company went nowhere. So he boiled a customer’s life down to five stages: Acquisition, Activation, Retention, Referral, Revenue.
Their initials spell AARRR, which is the noise a pirate makes. McClure noticed, and the name stuck. Nearly twenty years later, it’s still the framework a lot of product teams reach for first.
It survived because it answers the question people actually have when they open an analytics tool for the first time. Not “what can I measure?” You can measure everything. The tool will cheerfully help. The question is which few numbers deserve your attention this quarter.
A product metric is a question with a number attached
Product metrics are quantitative measures of how people use a product and whether it’s working for them. A good one is tied to a decision. If the number moved tomorrow, you’d do something differently. If you wouldn’t, it’s a vanity metric, however nice it looks on a dashboard.
You need two kinds. Quantitative metrics tell you what happened: active users, conversion rate, churn. Qualitative signals tell you why: interviews, surveys, usability sessions, open-text feedback. The numbers find the leak, and the conversations tell you what shape it is.
Marty Cagan’s version of this is outcomes over outputs. Features shipped is an output. The change in customer behavior those features caused is the outcome, and it’s the only one of the two a customer would ever notice, which is why teams that measure outputs get very good at shipping while teams that measure outcomes find out whether the shipping mattered.
Product metrics vs. growth metrics
Product metrics describe how users experience the product: are they finding value, where do they get stuck? Growth metrics describe how the business expands: how many new users arrive, and what each one is worth.
AARRR covers both, which is part of why it lasted:
| Stage | What it measures | Mostly a… |
|---|---|---|
| Acquisition | How people find you, and through which channels | Growth metric |
| Activation | Whether a new user reaches value in their first experience | Product metric |
| Retention | Whether they come back | Product metric |
| Referral | Whether they bring other people | Growth metric |
| Revenue | Whether all of the above turns into money | Growth metric |
The middle two are the ones the product team controls most directly. You can buy acquisition. You can’t buy people coming back.
Examples of product metrics at each stage
Here are the standard ones, with how each is calculated and what it tells you.
Acquisition metrics
Cost per acquisition (CPA). Total acquisition spend divided by the number of new customers in the same period. It tells you what a customer costs before they’ve done anything.
Traffic source. Where new users come from. It tells you which channels are worth more of your time.
Activation metrics
Onboarding completion rate. The percentage of new users who finish onboarding. A low number means people are leaving before they’ve seen what the product does.
First session length. How long a new user’s first session lasts. Useful, with a warning: a long first session can mean engagement or confusion, and only a conversation will tell you which.
Retention metrics
DAU/MAU. Daily active users divided by monthly active users. It approximates how many days a month the typical user shows up, which is a decent proxy for how habitual the product is.
Churn rate. The percentage of users or customers who stop using the product in a given period. Retention’s mirror image.
Referral metrics
Net Promoter Score (NPS). How likely users say they are to recommend you, on a 0 to 10 scale. Promoters (9 to 10) minus detractors (0 to 6). It measures stated intent, so pair it with the next one.
Referral rate. The percentage of new users who arrived through a referral. This measures what people actually did.
Revenue metrics
Average revenue per user (ARPU). Revenue in a period divided by users in that period.
Lifetime value (LTV). The total revenue you expect from a customer over the whole relationship. Compare it to CPA and you know whether acquisition is paying for itself.
Retention is the one to trust
If you only watch one number for product value, make it retention. Brian Balfour, founder of Reforge and former VP of Growth at HubSpot, has argued for years that retention is the foundation of growth. Every other stage leaks into it. If people don’t come back, better acquisition just fills a bucket faster that is already emptying.
Two other value signals are worth watching alongside it. Conversion rate tells you whether people take the step you designed for them, like starting a trial or making a purchase. NPS tells you whether they’d put their name behind you. Both can be gamed in ways retention mostly can’t.
How to pick the metric you’ll actually move
A list of good metrics doesn’t choose one for you. Here’s the process, with the judgment calls marked, using a real example.
Melissa Perri tells a story in her talk Escaping the Build Trap about a meal-kit delivery company that wanted more signups. When the team dug into the funnel, people were dropping off at the step where they entered their address. Digging further, a large share of them couldn’t find the food menu. They were being asked where they lived before anyone had shown them what they’d be eating. The team made the menu easy to find, and conversion went up.
Here’s that story as a process.
- Start from the outcome, not the dashboard. “More paying subscribers” is an outcome. “Improve the signup page” is a solution wearing an outcome’s clothes. The judgment call is keeping those apart.
- Find the stage that leaks worst. Lay the funnel out stage by stage and look for the biggest drop. In Perri’s story, it was activation, at a single form field.
- Pick one metric for that stage, and a counter-metric. Signup completion goes up if you remove the address field entirely. So does the number of meal kits you can’t deliver. The counter-metric keeps you honest.
- Ask why before you build. The funnel said where. It took more digging to learn why, and the why (they couldn’t find the menu) is what made the fix obvious. The customer discovery guide covers how to ask without getting lied to.
- Instrument before you ship. If the event you need doesn’t exist yet, add it first. Otherwise you’ll ship the fix and have nothing to compare it to.
Put the metric at the top of a tree
The most common way this goes wrong is that the metric lives in a dashboard, the ideas live in a backlog, and nothing connects them. Six weeks later, nobody can say which shipped feature was supposed to move which number.
In CardBoard, the fix is an Opportunity Solution Tree, the structure Teresa Torres popularized for continuous discovery. The outcome sits at the root. Opportunities (problems you heard from real people) branch under it. Solutions hang off opportunities, and experiments hang off solutions. CardBoard enforces that grammar: hang a solution straight off the outcome, skipping the opportunity, and the card gets flagged.
Perri’s story fits on a single branch: signup conversion at the root, “people can’t find the menu” under it, and the fix under that. The tree earns its keep when you take the same company one step further, past signup, to the number this post says to trust.
Say the meal-kit team’s next outcome is retention: more customers reorder in week 2. The opportunities come from talking to people who didn’t reorder. They didn’t know what to cook first. Ingredients went bad before they got to them. The box arrived when they weren’t home. Each one grows its own solutions, and the two cheapest solutions get an experiment small enough to run by hand.
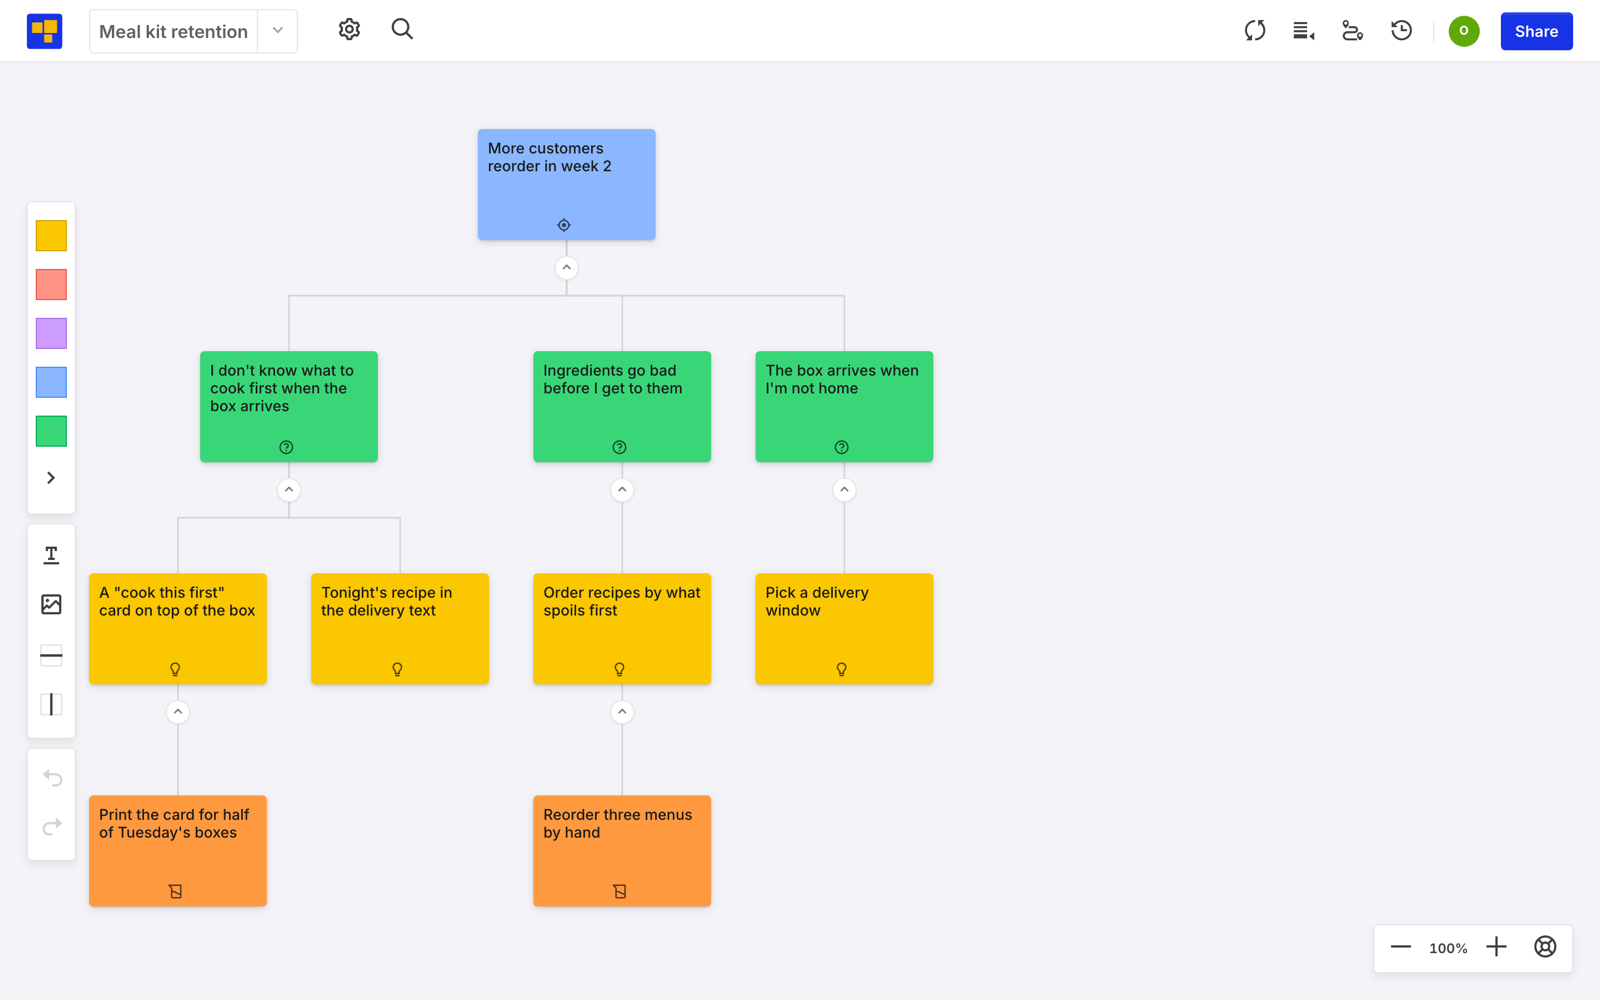
Every card on the tree points up at the number it’s meant to move. When the number doesn’t move, you can see exactly which bet didn’t pay off. Admittedly, it’s harder to hide a bad bet this way. That’s the feature.
If the retention side is where your funnel leaks, the Hooked model post is about slicing a release around it.
Tools for tracking product metrics
You’ll usually need one quantitative tool and one qualitative one.
Quantitative tools
- Google Analytics 4. Acquisition, traffic sources, and conversions, especially for marketing sites.
- Mixpanel. Event-based product analytics: funnels, user paths, retention.
- Amplitude. Similar ground to Mixpanel, strong on cohort and retention analysis.
- Heap. Captures interactions automatically, so you can define events after the fact.
- Pendo. Usage analytics combined with in-app guides and feedback.
- PostHog. Open-source product analytics with session replay, feature flags, and experiments in one tool.
Qualitative tools
- Qualaroo. Targeted in-product surveys.
- Open-text fields. Free-form questions in surveys and feedback forms. Cheap, and often the most honest data you’ll get.
- Intercom. Messaging that doubles as a direct line to users.
- UserTesting. Video, audio, and written feedback from people using your product.
- Hotjar. Heatmaps, session recordings, and on-site surveys.
Pick for the metric, not the logo. If your one metric is activation, you need a tool that does funnels well. Everything else can wait until you have a second metric, which, if this goes right, will take a while.