Product Backlog Management With a User Story Map
Here’s a scene most product teams will recognize. The details are made up. The shape isn’t.
You’re building a point-of-sale system for wholesale customers. Near the top of the backlog sits a clear, well-formed story:
As a warehouse manager, I want to scan items so that they can be added to a business customer’s bill.
An engineer picks it up and builds a solid scanning feature, with fast lookups and a count that updates as you go.
For inventory.
Nothing in the story was wrong. The engineer read “scan items” and filled in the rest from the last three scanning features they’d seen. The part that said this happens at checkout, between building the order and printing the invoice was never on the card. It was in the room the day the team talked through the flow, and it didn’t make it into the backlog, because a backlog has nowhere to put it.
A backlog is a to-do list, and to-do lists forget
A backlog is a to-do list. It’s very good at one question: what’s next? It’s built to answer that and nothing else. Every item on it was written with context: where it happens in what the user is doing, what comes before it, what it’s for. Ranking strips that out. Item 14 sits between 13 and 15 because of priority, not because they have anything to do with each other. For the difference between the list and the things on it, see product backlog vs user story.
So the list keeps the stories and loses three things about them. It loses context: the step a story belongs to and the reason it exists, which usually lives in its neighbors. It loses dependency: nothing on a list says that scanning is useless until the invoice prints, so a step with no stories under it looks like nothing at all. And it loses the meaning of done. The scanning story was checked off and counted. The list said Done. It had no way to say the warehouse manager still couldn’t check out. Then each person on the team fills those gaps from memory, a little differently, and you find out whose version was right at the demo.
David Hussman had a law for what’s being lost. Dude’s Law: value is why over how. The better you understand the why, the less how it takes to get there. A to-do list is a column of hows. Jeff Patton draws the same loss as a tree, in The New Backlog. The trunk is the goals, the branches are the users, the twigs are what they need, and the leaves are the stories. Then the team pulls off the leaves, bags them, and cuts down the tree. His name for a flat backlog: “a bag of context-free mulch.”

Grow the tree. Goals, users, what they need, stories. Everything connects.

Pull off the leaves. Just the stories.

Bag them. Cut down the tree. That’s a backlog.
After Jeff Patton, The New Backlog. Photos: Lone Tree by Benjamin Balazs (CC0); Leaf rake and leaves by David Goehring (CC BY 2.0); Raking Bad by Phil Roeder (CC BY 2.0). All three cropped.
.jpeg)

More process doesn’t help, because it manages the list harder, and the list is the problem. Longer refinement meetings and a fourteen-item definition of ready put more care into a bag of leaves.
Start from the person, not the list
Hussman said it in one line, in a talk deck that’s a decade old now: user experiences over user stories and product backlogs. The practice has moved since, through outcome-driven development, the product operating model, and now agents in the room. That line is the one that aged best, and it’s the fix.
An outcome is a change in what someone can do. So start from that someone, lay out what they’re trying to do, and work backward to the stories that would change it. That’s a user story map, the practice Hussman developed alongside Patton, who wrote the book on it in 2014, User Story Mapping: Discover the Whole Story, Build the Right Product. Instead of one long list, stories sit in the order a user does things, so every story keeps its place.
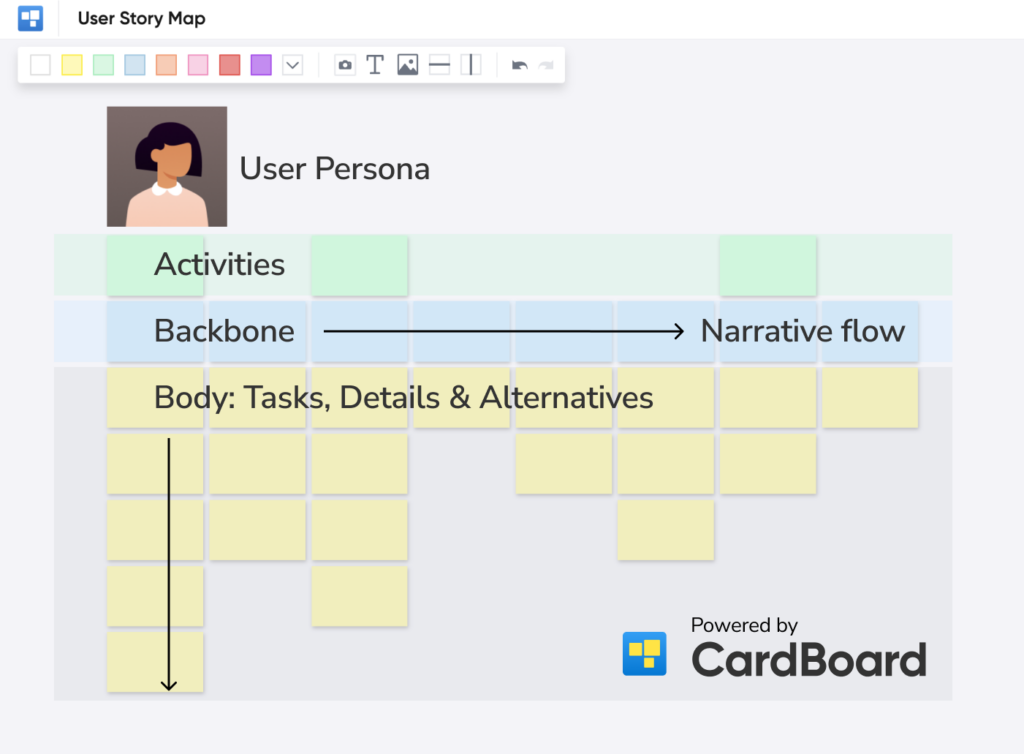
The same anchor makes a map a good place to run OKRs: the slice is the outcome, and everything above the line has to add up to it. I collect side quests, and the map is the fence that keeps them off the backlog. If a story doesn’t sit under a step in someone’s experience, it doesn’t go on the map.
Hussman’s team at DevJam built CardBoard to do this. What follows is the version you can run on a Tuesday with the backlog you already have: get it into a map, organize the map, and manage the backlog from there.
Step 1: get the backlog into a map
Backlogs live in different places. Many are in Jira or Azure DevOps. Some are in Linear or Trello, and a surprising number are a spreadsheet or a doc that one person keeps honest. The first job is the same wherever yours is: get the stories onto a canvas without retyping them.
Retyping matters more than it sounds. The moment you copy a backlog by hand, you have two backlogs, and the copy on the wall is the one nobody updates. The map has to start from the real items, or it starts out already drifting.
How that works depends on the tool. On a general whiteboard, importing a backlog usually means pasting titles onto sticky notes, and the sticky knows nothing about the ticket it came from. In a dedicated story mapping tool, you connect the tracker, pick the items you want from it, and they come in as cards that stay linked. For a backlog in a spreadsheet, export it to CSV and import that. For a backlog in a doc, ask an AI to turn the list into a Mermaid diagram and paste that in. Whichever route you take, you end up with a pile of cards and none of them in any order yet. In a dedicated tool, each one is still tied to its ticket.
Pick one user and one goal before you import, and pull in only their work. “A warehouse manager bills a wholesale customer for an order” is a map. “The POS system” is a quarter.
Step 2: organize the map
Budget a couple of hours with the product owner and two or three of the people who build it.
1. Lay out the backbone. Across the top, left to right, write the big steps the user takes. Build the order, scan the items, apply pricing, print the invoice, take payment. Read it aloud. If it sounds like a story someone could tell about their day, it’s right.
2. Sort the pile under the steps. Take each imported card and put it under the step it belongs to. This is where the scanning story lands under “scan the items,” next to “apply pricing,” and the question of what it’s for answers itself.
3. Look at what doesn’t fit. Cards that don’t belong under any step are either tasks dressed as stories, or they belong to a different user’s map. Cards that belong under two steps are usually two stories.
4. Look at the gaps. A step with nothing under it is work nobody has written down yet. In the list it was invisible. On the map it’s a blank column, and it’s awkward to walk past.
5. Order each column. Within each step, most important on top. Now the map has both axes: sequence left to right, priority top to bottom.
6. Slice releases across the whole map. Draw a horizontal line. Everything above it is the next release, and a user has to be able to get from start to finish on it. That rule does most of the prioritization for you. You can’t ship “scan items” without “print the invoice,” and on a map you can see that without anyone having to remember it.
This is the step where the tool shows its hand. On a whiteboard, the backbone is a row of rectangles that happen to be at the top, and the slice is a line you drew. Nothing knows a column is empty or that your release line cuts a step in half, so keeping the structure honest is a discipline you supply. In a tool that knows what a step and a slice are, the columns and dividers are objects, so the gaps show themselves and a card is in a release because it sits in one. Same picture. Different amount of work to keep it true. For the longer version of the technique, see the user story mapping guide.
Step 3: manage the backlog from the map
This is where most teams lose it. If the map and the backlog aren’t connected, every change has to be made twice: once on the map, once in the tracker. Someone has to be that person, and for a sprint or two they are. Then a ticket gets closed on a Friday, a story gets split in refinement, nobody touches the map, and now it’s wrong. Once it’s wrong nobody trusts it, and once nobody trusts it nobody opens it. The backlog is a to-do list again, and the map is a photo of a meeting.
If that has happened to you, the failure wasn’t discipline. Two copies of anything drift. The fix is one copy: stop treating the map as a workshop output and make it where backlog management happens. New stories go under their step. Reprioritizing means moving a card across a slice line, where everyone can see what else is on that side of it. Refinement is a conversation about a column, not a ticket. The tracker keeps doing what it’s good at, sprints and status and who’s on what, and the map keeps the user’s order for decisions.
For that to hold, the two have to stay one thing. Which brings us to the tool.
What to ask of a story mapping tool
Three things, one per step.
It has to bring the backlog in linked, not copied. Connect to Jira or Azure DevOps, choose the items, and they land as cards that still know which ticket they are. A CSV import covers the spreadsheet backlogs.
It has to know what a step and a slice are. A backbone, columns, and release dividers as real structure, so an empty column and a broken slice are visible without anyone checking.
It has to sync both ways and leave position alone. Edit a story’s criteria on the map and the ticket follows. Close a ticket and the card says so. But the tracker’s order is for sprints and the map’s order is for users, and a tool that forces one on both has handed you a list with a nicer font.
Sticky notes on a wall fail all three and are still the right call for a co-located team’s first session. After that, we compare the field, including tools that aren’t ours, in the best user story mapping tools.
How CardBoard does it
CardBoard is the user story mapping tool featured in Patton’s book, built by Hussman’s team for this job.
Step 1. Start a board with the user story map type and connect it to Jira or Azure DevOps. The sync drawer lists the tracker’s work items, narrowed by a Jira filter or an Azure DevOps query if you set one, so Done work and other teams’ work stay out of view. Add them all, or hand-pick the ones that belong to this user and this goal. Backlogs that live in a spreadsheet come in through CSV import. Either way, cards arrive linked.
Step 2. Cards snap into columns, one per step. Dividers across the map mark release slices, a slice is named for the outcome it delivers, and a card belongs to a slice by sitting inside it. On a long map, you can collapse the slices you aren’t working on.
Step 3. The work-item fields (title, status, description, acceptance criteria, parent, and assignee) sync in both directions. One thing doesn’t sync, on purpose: where a card sits. Position is the map’s job.
Back to the warehouse manager. On a map, the scanning story sits under “scan the items,” with “build the order” to its left and “apply pricing” to its right. It’s hard to read that row and build an inventory feature. Not impossible. Just hard.
Start free. Three boards, no credit card.
Frequently asked questions
What is product backlog management?
Product backlog management is the ongoing work of deciding what goes on the product backlog, in what order, and in how much detail. In Scrum, the Product Owner is accountable for it. It includes adding and removing items, ordering them, and refining them with the Developers so the next few are ready to build.
How do I get an existing backlog into a story map?
Connect the map to the tracker instead of retyping. In CardBoard, a board connected to Jira or Azure DevOps shows the tracker’s work items in a sync drawer, narrowed by a Jira filter or an Azure DevOps query, and you add all of them or hand-pick which become linked cards. Backlogs kept in a spreadsheet come in through CSV import. Retyping creates a second copy, and the second copy is the one that goes stale.
How does a user story map help manage a backlog?
A story map arranges backlog items in the order a user does things, so every item keeps its context: which step it belongs to and which release it’s in. That makes gaps visible, and it turns prioritization into drawing a release line that has to work from start to finish.
Does a story map replace the backlog?
No. The map is where you decide what to build. The backlog, usually in Jira or Azure DevOps, is where the team tracks building it. They work best connected.
Do I need a story mapping tool to manage a backlog this way?
Not for the first session. A wall and sticky notes work. You need one the moment refinement moves onto the map, because a map nobody can sync with the tracker drifts out of date and gets abandoned. Look for a tool that imports the backlog linked, knows what a step and a release slice are, and syncs both ways with Jira or Azure DevOps. The best user story mapping tools comparison covers the options.
Who created user story mapping?
Jeff Patton popularized the technique and described it in his 2014 book, User Story Mapping: Discover the Whole Story, Build the Right Product. David Hussman, founder of DevJam, developed the practice alongside him, and his team built CardBoard, the tool featured in the book.