User story mapping arranges a product’s work along the sequence of a user’s journey. Activities run left to right across the top as the backbone. User stories and tasks hang beneath each activity in order of importance. Horizontal release slices cut across the map to group the stories that together deliver an outcome.
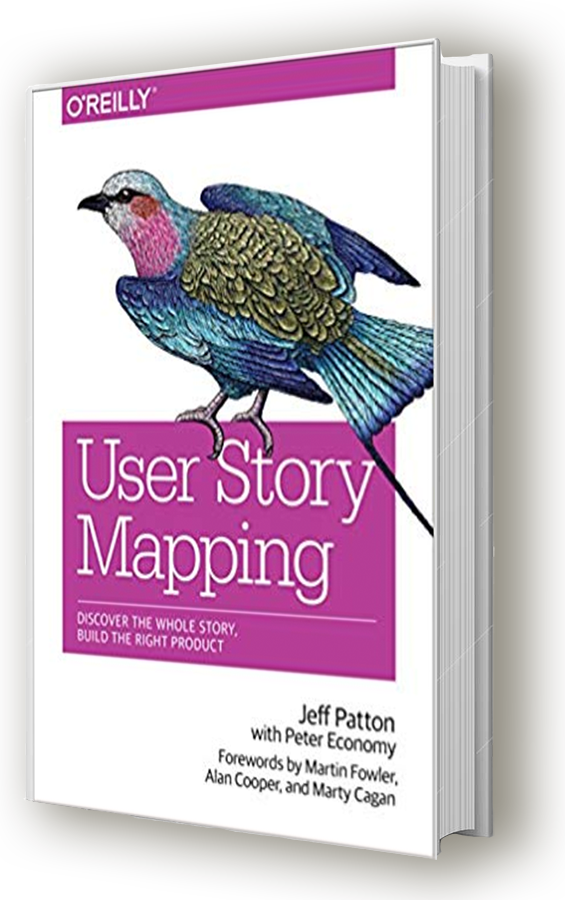
Jeff Patton canonized the practice in his 2014 book. CardBoard is the user story mapping tool featured in it.
It matters more now than it did then. Flat backlogs still hide the journey behind a ranked list. Teams are measured on outcomes, not shipped features. And AI agents read plans directly now — they can reason about a typed backbone and named outcomes, but only guess at a list of tickets.
What is user story mapping?
Every card on a map has a position, and both directions mean something. Horizontal position is sequence: the order a user does things. Vertical position is priority and detail: the behaviors, alternatives, and edge cases under each step.
That second direction is the whole trick. A backlog tells you what matters most. A map tells you what matters most and where it happens.
Picture a wall. A left-to-right row of cards across the top spells out the journey. Under each one hangs a column, deepest where the product is richest. Two or three horizontal lines run the full width, dividing the columns into bands: above the first line is what you’re building now, below it is what you’re not building yet.
The parts
Backbone and activities. The top row, read left to right. Each card is a high-level step a user takes — “check out,” not “click the green checkout button.” An activity should survive a redesign of whatever implements it. Most journeys land between five and fifteen. Read the row aloud: if it sounds like a story someone could tell about their day, it’s right.
User stories and tasks. Under each activity hang the specific behaviors that make it real: “apply a promo code,” “check out as a guest.” Writing them well is its own discipline. Tasks are what a story breaks into once you commit to building it — add that depth only when a story is too big to build in one piece.
Release slices. Horizontal lines across the full width. Everything between two lines is one slice: stories from many columns that add up to something a user can do end to end. In CardBoard a slice is a divider, and a card joins by sitting inside it. Slicing is subtractive. You’re asking what’s the least this journey can contain and still be a journey — and you can shape early slices around the habits you want to form.
Outcomes. Why these cards are together. In CardBoard the divider’s name is the outcome’s name, so you can’t slice a map without someone being asked what the slice is for. “Release 1” is a schedule — it tells you when, never whether you succeeded. “A new customer can buy without calling support” can be observed after launch, and it can be wrong.
Each story carries two memberships at once: one activity, one slice. A backlog expresses one ranking. A map holds both, so product structure and release scope stay in the same picture.
Where it came from
Patton’s book came out of a decade of teaching teams to work this way. The late David Hussman — Patton’s friend, and the coach whose team at DevJam built CardBoard — learned it alongside him and pressure-tested it with teams at companies like Target.
Hussman had a law for what the map protects. Dude’s Law: value is why over how. The better you understand the why, the less how it takes to get there. A backlog flattens the why into a list of hows.
Why story maps beat flat backlogs
Patton’s objection is a metaphor about a tree. The trunk is the system, the branches are activities, the leaves are stories small enough to build. A team grows that tree together — and then, he writes, “we pull all the leaves off the tree and load them into a leaf bag – then cut down the tree.”
That’s what a flat backlog is to me. A bag of context-free mulch.
— Jeff Patton, The New Backlog
Every leaf survives that move. The tree was the part that told you which leaves mattered.
Rank a product backlog however carefully you like and it still can’t show you that items 3, 19, and 40 are three halves of one journey, and that shipping two of them strands the user. On a map the three cards sit above the same slice and the gap between them is a hole you can point at.
Gaps announce themselves for the same reason. A step every user takes that nobody wrote a story for is obvious in a left-to-right sentence and invisible in a list of two hundred ranked items. That’s also what protects the small unglamorous stories that get cut right up until the journey breaks without them.
Patton’s most quoted line is that shared documents aren’t shared understanding. A backlog is written by one person and read by everyone else, so agreement with it is assumed. A map gets built by the room, and the disagreements surface while the cards are still moving.
None of this makes the backlog wrong. It makes it downstream — the map decides what to build, the backlog tracks building it, which is the normal arrangement in any agile process. Teams who manage the backlog through the map keep both.
How to create a user story map
Seven steps. They work with sticky notes on a wall and on a shared board — what matters is that everyone sees the whole map and can move a card without asking. Physical notes win in a co-located room. A digital board wins for everything else: remote people, a map that outlives the session, and cards that carry detail behind them instead of whatever fits on three inches of paper. Facilitation is its own skill, separate from the mechanics below.
The example running through these steps is Luke, who needs to get ready for work.
Your first session: ninety minutes, four to six people, one user’s journey. You’ll finish with a backbone you can read aloud, a column of stories under each activity, and one slice the team agrees is shippable. That’s the whole unit of practice, and it’s repeatable — the second map is faster than the first, and by the third you’ll stop looking at the steps.
Expect the first backbone to be wrong. Everyone’s is. You’ll write eight activities, read them out, hear that two are the same thing and one belongs in the middle, and fix it in about a minute. That’s the technique working, not failing. The map is cheap to change on purpose so that being wrong early costs nothing.
If you need to sell the session to someone skeptical: ninety minutes to find out whether we agree on what we’re building, before anyone spends a sprint finding out we don’t.
Step 1 — Define your user and their goal
Name one user and one goal out loud before a single card goes up. Not a segment — a person with a situation. “Luke, a tech employee who needs to get out the door ready for work.”
Now every later argument has an answer. The question is never “is this valuable?” — everything is valuable to someone — but “does Luke need this to reach his goal?” If two users’ journeys differ, that’s two maps.

Step 2 — Map a “happy path” of tasks
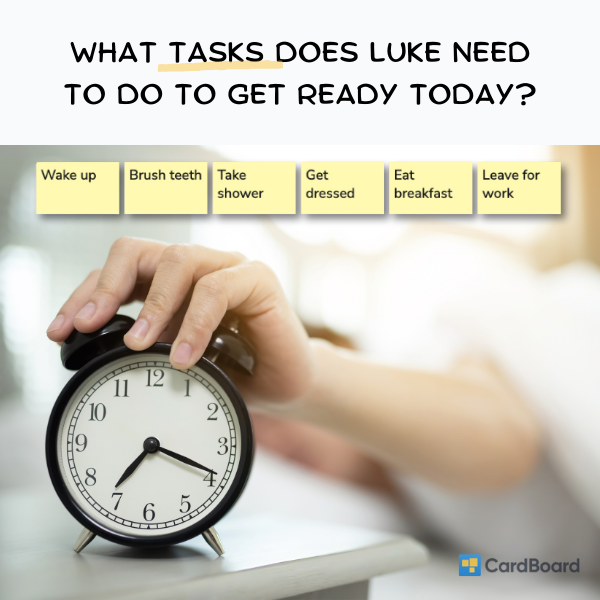
Go wide and shallow. Left to right, write what Luke does on the day everything goes right. Wake up, brush teeth, take shower, get dressed, eat breakfast, leave for work.
Keep it fast and flat. The most common way to lose an hour is elaborating step one before step six exists. Silent writing helps — everyone writes at once, then you lay the cards out together — because it stops the loudest person in the room from defining the product.
Step 3 — Group tasks under activities
Notice which cards are the same chunk of the day. “Brush teeth,” “rinse,” and “floss” aren’t three stages; they’re three behaviors inside morning hygiene. Write a card for the chunk, put it above them, and you’ve made an activity.
The map just became two-dimensional. You aren’t adding information, you’re revealing structure that was already there. Check the grouping against Luke: he’d recognize “morning hygiene” as a thing he does.

Step 4 — Sequence the backbone left to right
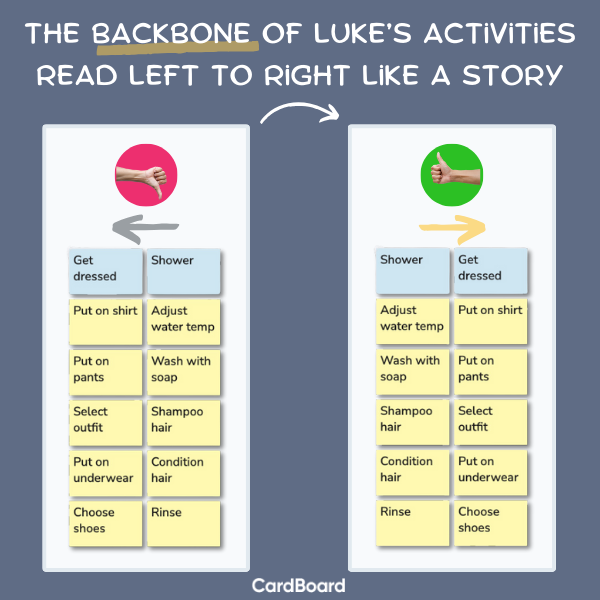
Put the activities in the order Luke performs them, then read the row aloud. It should sound like someone describing their morning.
Getting this wrong isn’t cosmetic. “Get dressed” before “shower” is a different and worse morning. Reading the backbone aloud is the cheapest test in the practice, and it catches ordering errors that look fine when you stare at them silently.
Step 5 — Break activities down and prioritize top to bottom
Now go deep. Under each activity, write the stories that make it real and order them by how essential they are. The card nearest the activity is the one Luke can’t skip.
Under breakfast, coffee goes on top — not because it’s complex, but because a breakfast without it fails Luke’s morning in a way a breakfast without a cooked meal doesn’t. Vertical order is about necessity, not effort or sequence. This is prioritization, not scheduling, and confusing the two turns maps back into to-do lists.

Step 6 — Review and refine
Interrogate the map before committing to anything:
- What did I miss?
- What happens when something goes wrong?
- What other choices could the user make?
- Who else depends on this journey?
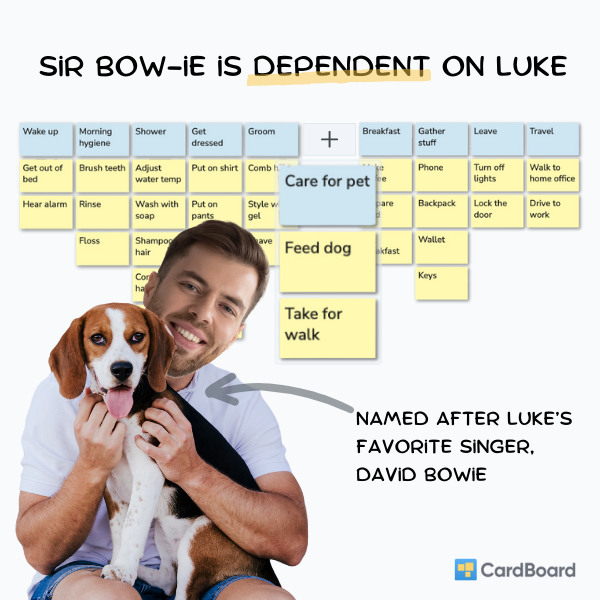
That last question finds Sir Bow-ie. Luke’s map looked finished — nine activities, every column filled — until someone remembered the dog needs feeding and walking before Luke can leave. A whole activity, missing from a map that looked complete. Reviewing is the step most likely to change the backbone, which is why it comes before slicing.
Step 7 — Divide the map into releases
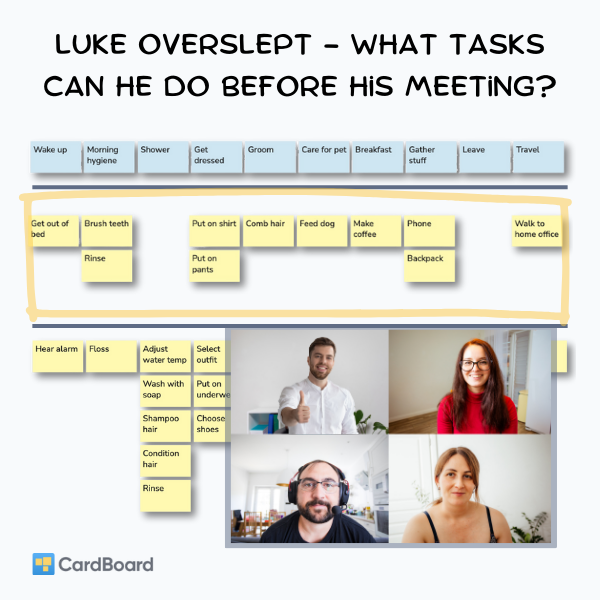
Draw a line across the full width and put above it only what Luke needs to get from beginning to end under one constraint. Read the band left to right and confirm it’s still a whole story.
Name the constraint and the slice becomes an outcome instead of a batch. Luke overslept and has a meeting in ten minutes: what can he do and still be ready? He gets out of bed, brushes his teeth, throws on a shirt and pants, feeds the dog, makes coffee, grabs his phone and backpack, walks to the home office. No shower, no floss, no cooked breakfast, no drive. Unglamorous, complete, shippable. Everything below the line isn’t cancelled; it isn’t in this release.
Who should participate?
A map is worth the perspectives in the room, and the ones that change it most are rarely the ones who called the meeting.
- Product — what the business needs this journey to produce.
- Engineering — which steps are expensive, and which innocent-looking card hides a rewrite.
- Design — what users do, as opposed to what the flow diagram says they do.
- QA — the paths nobody drew: what happens when it fails, and when it fails twice.
- Support — where real users get stuck today. The cheapest research you already own.
- Sales and marketing — the promise the customer arrives holding.
Five or six people hold a conversation. Twelve hold a presentation, and a presentation won’t change the map.
Story mapping vs related methods
These get treated as rivals. They answer different questions, and teams routinely use two or three on the same work — which is why CardBoard keeps them as separate map types instead of forcing everything onto one canvas.
Journey map. Describes the experience someone already has, including the parts you don’t control — what they do, think, and feel across touchpoints. Its output is pain points. A story map describes what you’re going to build, and every card is something a team could ship. Use a journey map when you don’t yet know where the experience hurts; pair it with an empathy map to understand the person. Journey maps diagnose. Story maps commit.
Impact map. Works backwards from a goal, branching to actors, to behavior changes, to the deliverables that might cause them — a tree for pruning assumptions before you build. Use one when the goal is agreed but the means aren’t, or when you need to kill scope rather than sequence it. An opportunity canvas does similar work at smaller scale. The two chain neatly: impact-map to choose the bet, story-map to deliver it, and the behavior change makes a strong name for your first slice.
Process map and storyboards. A process map documents a workflow as it operates, exception paths and all; its fidelity is what makes it a poor planning artifact, because a map of everything can’t tell you what to build first. A storyboard is the opposite — a few frames with enough detail to feel real. Use the first to document an existing operation, the second to sell an experience to people who won’t read a board of cards.
PRD. What makes a requirements document complete: a goal, scope, the requirements, acceptance criteria, constraints, dependencies, and a record of what was decided. Every one of those has a home on a map, because a card is not a sticky note:
| What a PRD carries | Where it lives on a map |
|---|---|
| The goal | The outcome naming the release slice |
| What’s in this release | The slice — structural, not a heading |
| The requirements | User stories, under the activity they belong to |
| Detail, constraints, non-functional requirements | The card’s description — rich text, as long as it needs |
| Acceptance criteria | A dedicated field on the card |
| Dependencies | Connections between cards |
| Breakdown of a large requirement | Parent and child cards |
| Rationale and decisions | Comment threads on the card the decision was about |
| Traceability into delivery | Tracker links to the Jira or Azure DevOps item |
See card properties for the full list; title, status, description, acceptance criteria, parent, and assignee all sync to your tracker.
So a map isn’t a lighter-weight alternative to a spec. It’s a spec that can be sliced — a document has no vertical axis, so “what’s in the first release” is a heading someone typed rather than something you can see and rearrange.
The usual objection is that regulated work needs a document. Regulated work needs traceability, access control, and an audit trail: which requirement produced which change, who made it, when. Those are properties of the system holding the spec, not the file format. CardBoard records change events, attributes every tracker write to the member who made it, enforces organization- and board-level permissions, and supports SAML SSO — the security and compliance reference has the details. Use a PRD when the deliverable has to be a document: a contract, an RFP response, something signed and filed. If you already have one, spec mapping turns it into a map without retyping it.
Flat backlog. Covered above. A backlog is a ranked list optimized for execution; a map is a model optimized for deciding what execution should contain. Nearly every team runs both.
Story mapping and modern practices
The mechanics haven’t changed in twenty years. What’s changed is everything around the map.
OKRs. Most die in translation: the objective is agreed in a meeting, the key results go on a slide, and the team returns to a backlog with no visible relationship to either. A key result is a statement about changed behavior — “new customers reach first purchase without contacting support” — which is exactly what a slice can be named. Name it that and the cards above the line are the work that moves the number. If you can’t name a slice with any of your key results, the map and the goals are about different things, and week one is a better time to learn that than the quarterly review. Pair it with real product metrics so the name is something you can observe, and see OKRs and user story maps for writing the key results in the first place.
Specs and PRDs. A document is correct the day it’s signed and drifting the day after. A map is the thing being built from, so keeping it current is the same act as planning. When a story turns out to be three stories you split the card; when a constraint appears it goes in the description of the card it constrains, where the person building that card will see it. Spec mapping is the path in from a document or an AI-generated flowchart.
Tracker sync. The most common way a map dies: the workshop ends, the stories move into Jira, and the map becomes a photograph on a wiki. Connect a card to its Jira or Azure DevOps item and title, status, description, acceptance criteria, parent, and assignee mirror both ways. Position never syncs, which is the design: the tracker has no concept of where a story sits in a journey. Plan on the board, execute in the tracker, and the board stays true without anyone maintaining it.
AI agents. Every model can produce a diagram now, and then it dead-ends, because a picture in a drawing tool isn’t a plan. Generation got cheap; structuring stayed manual. Two things close the gap. Mermaid is the diagram syntax models already emit — paste it into CardBoard and the board builds itself. And on a typed map the structure is declared rather than inferred: the map knows the top row is the backbone, that a card under an activity belongs to it, that a slice is a release. An agent reading free-floating boxes has to guess, and guessing is where agents go wrong. An agent reading a typed map can propose a card in a specific place and be told whether that place is valid. CardBoard for agents covers how that connection works, and the theory of maps covers the model underneath.
Common mistakes
Going deep before the backbone reaches the end. The room writes “wake up,” spends forty minutes on snooze behavior, and never reaches “leave for work” — the one thing a backlog can’t give you. Instead: finish the backbone end to end before adding a single card below it. Time-box the first pass to twenty minutes and park rich edge cases on a card off to the side.
Confusing activities with tasks. A card reading “manage account settings” sits in a story column. It’s a stage of the journey wearing a story’s clothes, and any slice cutting through it means something other than you think. Instead: apply the altitude test — would the user recognize it, and would it survive a redesign of the feature underneath? If so, promote it to the backbone.
Slices that are schedules. “Release 1,” “Release 2,” “Later.” Nothing is wrong and nothing is learnable; months later nobody can say whether the release did what it was for. Instead: name each slice with what becomes true when it ships. If a slice resists that, it’s a batch of unrelated work.
Only product people in the room. One perspective, presented to everyone else as finished. It will be missing the constraint the engineer knew, the failure mode support sees weekly, and the step the designer knows users take. Instead: build it with whoever knows something, and use silent writing for the first pass. A map handed to you is worth much less than one you helped build.
Mapping the product instead of a journey. The backbone starts naming software — “dashboard,” “settings,” “reports.” Usually nobody named a user, or two users’ journeys got merged to save time. Instead: name one user and one goal first. If the top row reads like a site menu, you’re mapping the product.
Letting the map go static. Someone photographs the wall, the stories get retyped into the tracker, and two months later the map describes a product nobody is building. People blame story mapping rather than the abandonment. Instead: connect cards to tracker items so status arrives on its own, and revisit the map when scope changes. A map that changes is a map that’s being used.
Tools, and how CardBoard fits
Sticky notes and a wall are still an excellent choice for a co-located team’s first session. Beyond that the options are general whiteboards, where a map is a drawing you maintain by hand; trackers, which hold the work but can’t show a journey; and dedicated mapping tools, which know what a backbone and a slice are. We survey the field — including tools that aren’t ours — in the best user story mapping tools.
What matters when choosing is whether the tool understands the structure or just renders it. On a whiteboard a story map is an arrangement of rectangles: nothing knows the top row is a backbone, so nothing can tell you a slice has a hole in it, no status flows in from the work, and an agent sees only boxes. The picture is identical. Everything you can do with it afterwards isn’t.
What CardBoard does differently:
- Outcomes are first-class. The slice is a divider and its name is the outcome’s name.
- Two-way tracker sync that keeps your thinking space. The work-item fields mirror; position never does. See Integrations.
- Structure agents can read. Every map is typed, so an agent proposes into a specific place and gets told whether it’s valid.
- Guests are free on every plan, including the free one. The paid gate is board capacity and author seats, not features.
- Mermaid goes in, a real map comes out.
Story mapping (the practice) isn’t the same as the user-story-map map type (the canvas). Other map types play supporting roles — a kanban for breaking down a slice, a persona for defining the user.
The fastest way to feel the difference is to build a map instead of reading about one. The user story mapping tool page shows a live board with its backbone, slices, and outcomes in place, or you can open a free workspace and map the journey your team is arguing about this week. Three boards, no credit card, guests included — so you can put the map in front of the people whose disagreement you’re trying to surface.
Examples and templates
A checkout flow. Browse → add to cart → enter details → pay → confirm. The temptation is to make “pay” enormous, but the stories that decide whether the release works are elsewhere: guest checkout, saved addresses, the confirmation email that prevents the support call. A good first slice is humble — one payment method, no saved cards, no promo codes, a receipt.
SaaS onboarding. Sign up → set up the workspace → invite the team → do the first real thing → come back tomorrow. That last activity is the one teams leave off the map and the one the business depends on. Naming a slice “a new user returns on day two” instead of “onboarding v1” immediately changes which stories rise to the top of their columns.
An internal tool. Expense approval runs submit → route → review → approve → reimburse. Two users whose paths diverge, which is the case for two maps rather than one crowded backbone. The real value here is usually discovering that a step everyone assumed was automated is someone’s inbox.
Measuring success and next steps
Measure yourself first. After one session you should be able to name a user, lay a backbone that reads aloud as a story, and cut a slice your team agrees is shippable. That’s competence, and it’s most of the value.
By the third or fourth map you’ll be doing the things that separate a useful map from a tidy one: catching the activity nobody wrote down before someone builds around the hole, refusing a slice that strands the user halfway, naming an outcome specific enough that it could turn out to be wrong. At that point you’re the person in the room who can run this, which is a more useful thing to be than the person who has read about it.
Then judge the map by what changes around it. Scope conversations get shorter, because “is this in the first release?” is answered by pointing. Releases ship whole instead of delivering three-quarters of a journey. Fewer features arrive that nobody asked for. And the strongest signal: the map is still being edited a month later.
The failure signals are as clear. Every slice named after a date means outcomes haven’t taken hold. A map unchanged since the workshop has become documentation. If only one person ever moves a card, you have a document with a spatial layout.
Next: the facilitation guide for the room itself, spec mapping if your requirements arrive as documents, and the tools comparison if you’re choosing where to build.
Learn more
Resources from product experts who teach story mapping:
- Book — User Story Mapping by Jeff Patton
- Course — Jeff Patton: Passionate Product Leadership
- Course — Angela Wick: User Story Mapping
Frequently asked questions
What is user story mapping?
User story mapping is a technique that arranges a product’s features around the user’s journey. It gives teams a visual layout of the sequence of user actions, helping prioritize development, identify gaps, and plan releases — keeping development aligned with user needs and business goals.
What tools do you need for story mapping?
You need a way to represent stories visually (sticky notes or digital cards), space to arrange them (a large wall or a digital board), and a way to detail and label them (markers or online tools). Together these support a clear, organized view of the user journey.
When is user story mapping done?
Typically at the beginning of the product development process or at the start of a new phase. It helps teams align on vision, break work into manageable components, and prioritize what to build first. It’s also revisited throughout development to reflect changes, new insights, and feedback.
How long does story mapping take?
A session usually ranges from a few hours to a full day. Larger or more complex projects may need multiple sessions over several days. The process is adaptable, and teams commonly update the map throughout the project to reflect new insights.
What’s the difference between user story mapping and a product backlog?
Both are agile tools with distinct purposes. User story mapping creates a visual representation of the user journey, organizing stories across a timeline to show how features interconnect — a strategic overview that aids prioritization. A product backlog is a prioritized, more linear list of tasks (stories, bugs, enhancements) for day-to-day execution. Story mapping gives the strategic overview; the backlog provides the tactical, ordered list.
Written by Josh Colter, who owns and builds CardBoard — the story mapping tool featured in Jeff Patton’s User Story Mapping. It was created at DevJam by David Hussman’s team, who taught the practice alongside Patton and pressure-tested it with teams at companies like Target; Josh bought it from SEP to keep that work going. Having come up through sales and marketing — the far side of the wall between the people who want software and the people who build it — Josh now builds CardBoard around a theory of maps: one plan, drawn for people and typed for machines.
Last updated 15 August 2026.