How to make a network diagram in under two hours
In February 2021, Sam Ess drew a network diagram in CardBoard. His title at SEP, a software company, was JR IT Janitor, which is the most honest description of network administration I’ve ever read.
It took him less than two hours from start to finish. His verdict:
“Compared to yEd or Visio, it’s easier to share, and simpler to use.” (Sam Ess)
A network diagram is a picture of who can talk to whom
A network diagram is a visual representation of a computer or telecommunications network. It shows the devices on the network (routers, switches, firewalls, servers, workstations) and how they connect.
Here’s a basic local area network (LAN):
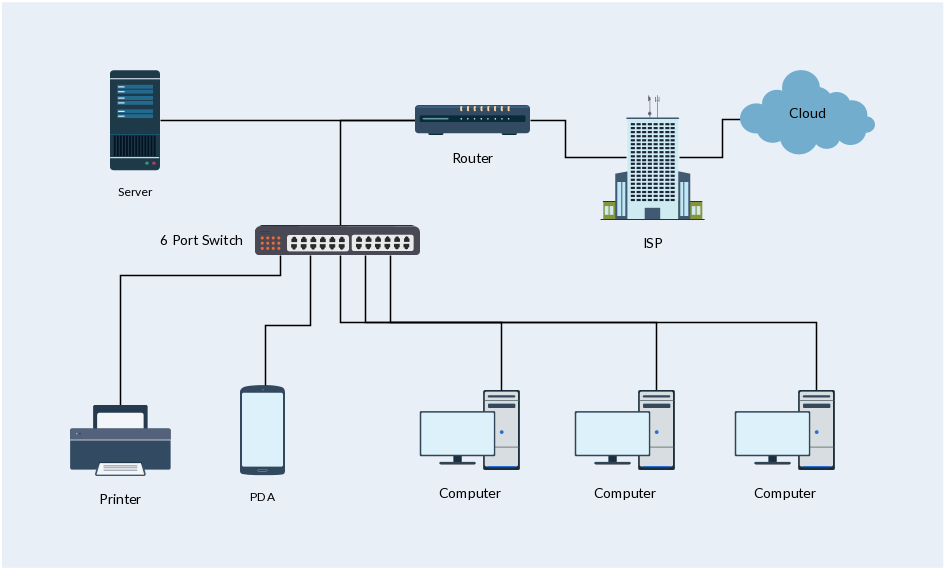
You could shuffle every box in that picture and it would still be accurate, as long as the lines stayed attached. The positions don’t carry the information. The connections do. That’s the difference between a diagram and a map, which I wrote about in text is for machines, maps are for us, and it tells you where to spend your effort. Get the lines right first. Neatness can wait.
What teams actually use them for
Showing how the pieces connect turns out to be useful for a surprising number of jobs:
- Planning a new home or office network
- Updating an existing network without breaking what already works
- Sending vendors enough detail for an RFP without sharing anything confidential
- Onboarding new IT staff, and documenting the network for people outside the team
- Troubleshooting, when you need to know what sits between a user and the thing that’s down
- Compliance work, like PCI, where an auditor wants to see how data is segmented
- Selling a network proposal to the people who pay for it
- Keeping track of what you own
- Proposing changes to logging infrastructure, like where syslog gets collected
How to make a network diagram
Start by picking a goal. It’s better to make several diagrams, each showing one aspect of the network, than to cram everything onto one. A physical diagram (what’s plugged into what) and a logical diagram (which traffic can reach which segment) answer different questions, and one picture trying to do both usually answers neither.
Once you’ve picked the network and the question, here’s the process Sam used, adapted to today’s CardBoard. His screenshots below are from 2021, and a few things have changed since.
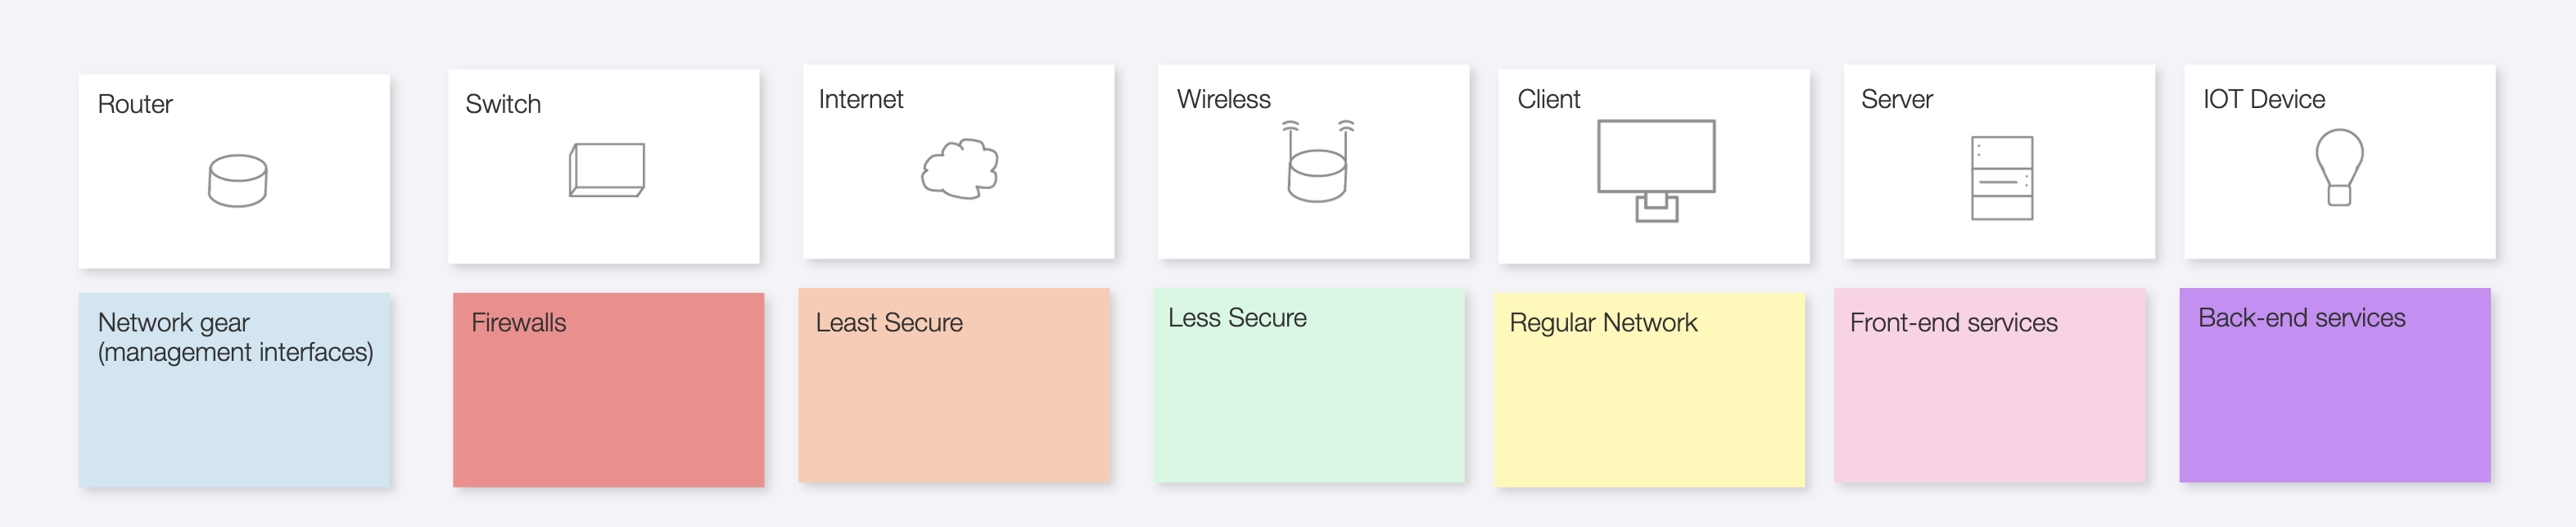
- Build a legend, then list the equipment. Before any gear goes on the board, decide what each color and shape means and put that key in a corner, the way Sam did above. Then add a card for every workstation, server, router, firewall, and access point in scope. Don’t connect anything yet. In CardBoard, start from the freeform canvas map type so cards stay exactly where you put them. The 2021 legend used icons on the cards. Today, right-click a card to change its shape instead: the internet can be a circle, the firewall a diamond, and anything that stores data a cylinder.
- Group related cards. Move cards that belong together close to each other. Depending on the diagram, “together” means physically (same closet, same floor) or logically (same VLAN, same trust level).
- Add the connections. A line between two cards says they’re connected, usually by the flow of traffic. This is the step that carries the meaning, so be strict about it. In CardBoard, connections can have arrowheads and labels, so a line can say “VLAN 20” instead of leaving people to guess.
- Label what the audience needs. Put useful detail next to each device, like an IP range or a model number. If that gets crowded, number the devices and move the detail into the card’s description, where it’s one click away instead of in everyone’s face.
- Tidy up last. Adjust placement and color until the picture reads cleanly. This is the step people like to start with, which is why it’s last.
Here’s the whole process on a small office network, drawn in today’s CardBoard.
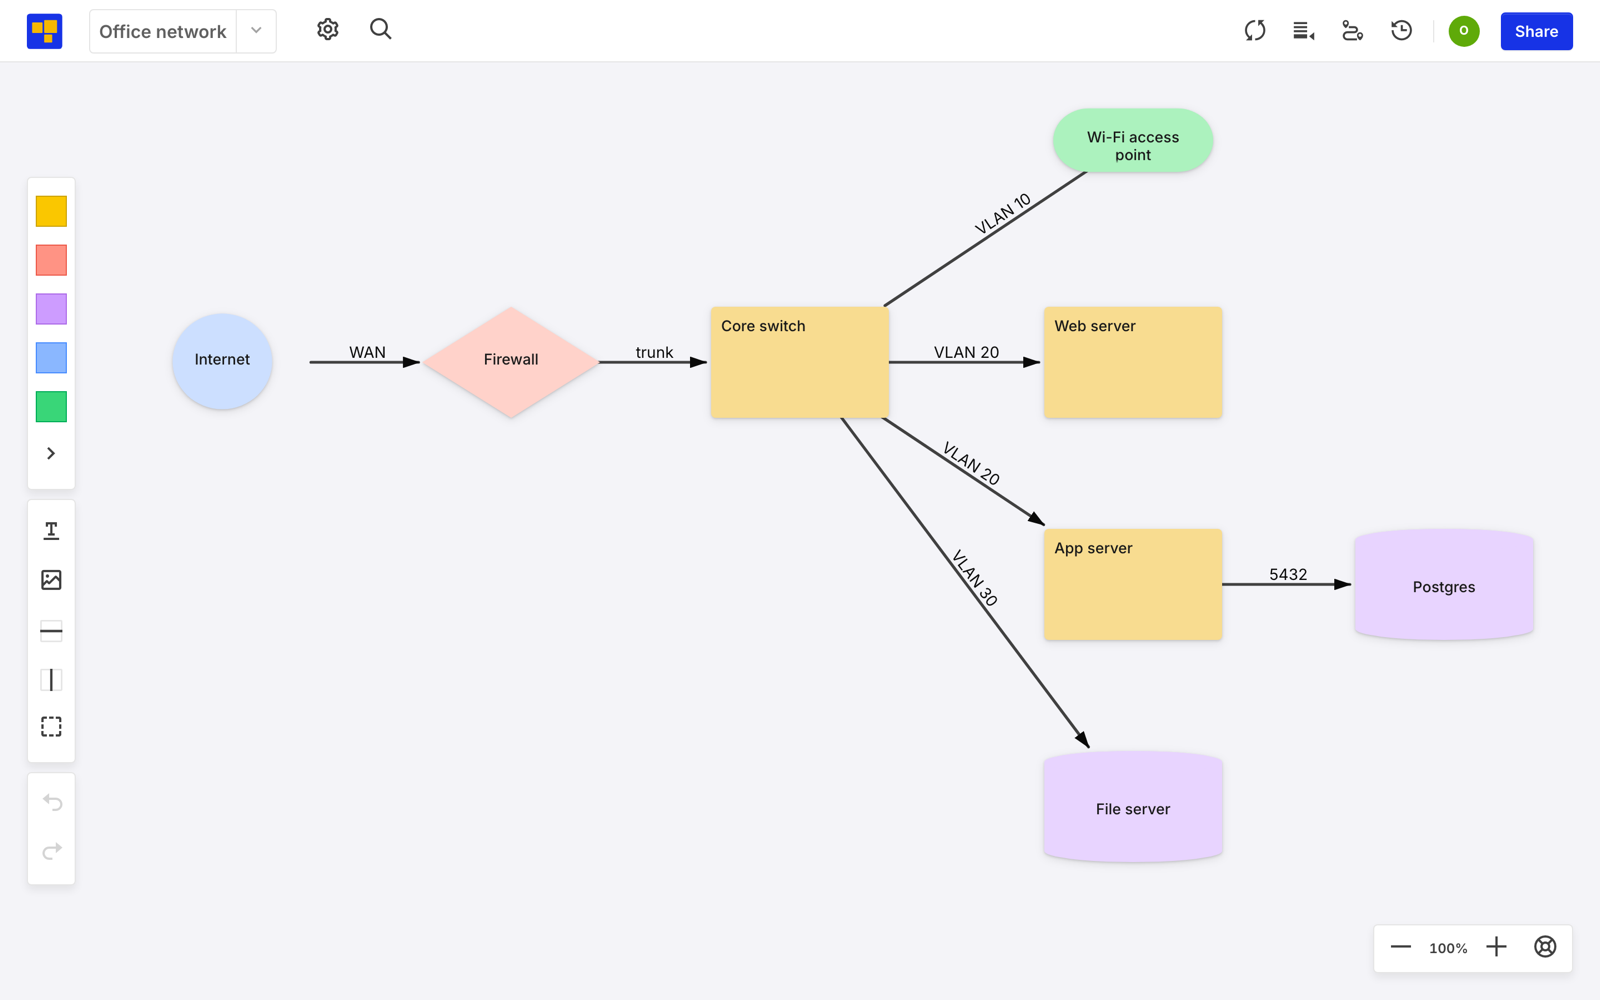
Every connection carries a label, so nobody has to guess which VLAN the file server sits on, or which port the app server uses to reach Postgres.
Sam’s tips
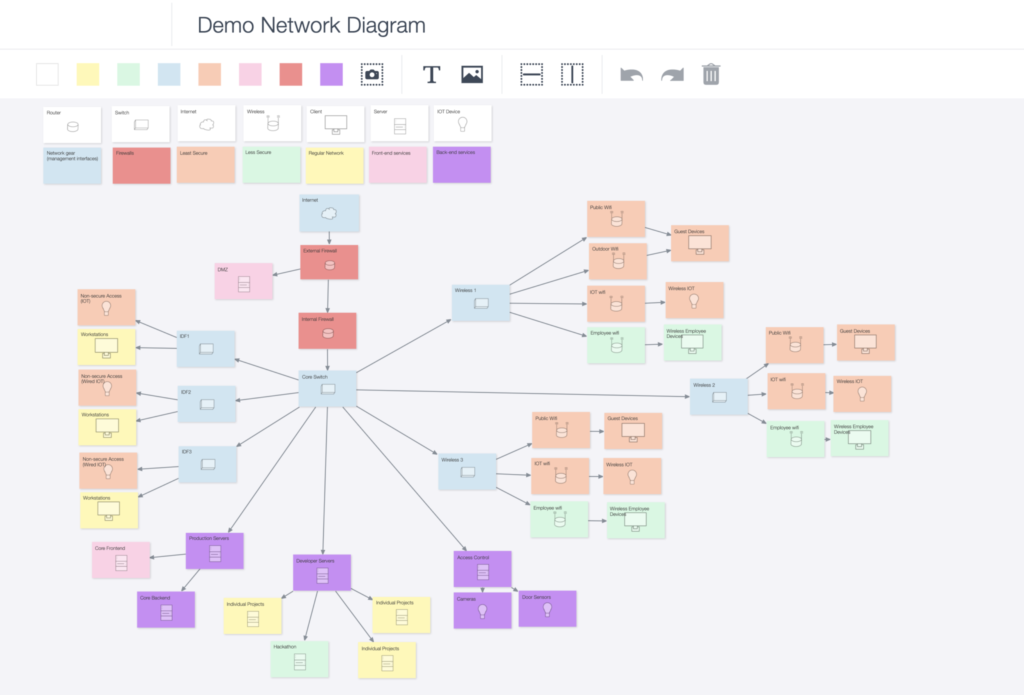
Sam’s tips were four short lines. Here they are with my reasoning filled in.
The first was to keep cards off the grid. A network doesn’t line up in neat rows, and forcing it to makes the diagram lie a little about how things connect. On a freeform canvas, position is whatever you decide.
His second was to point every arrow the same way, either down from the internet or up into it. When arrows point both ways, readers can’t tell where traffic starts, and the diagram stops answering the question it was drawn for.
He also labeled every card, even the obvious ones. “Wireless 2” is obvious to the person who drew it and to nobody else.
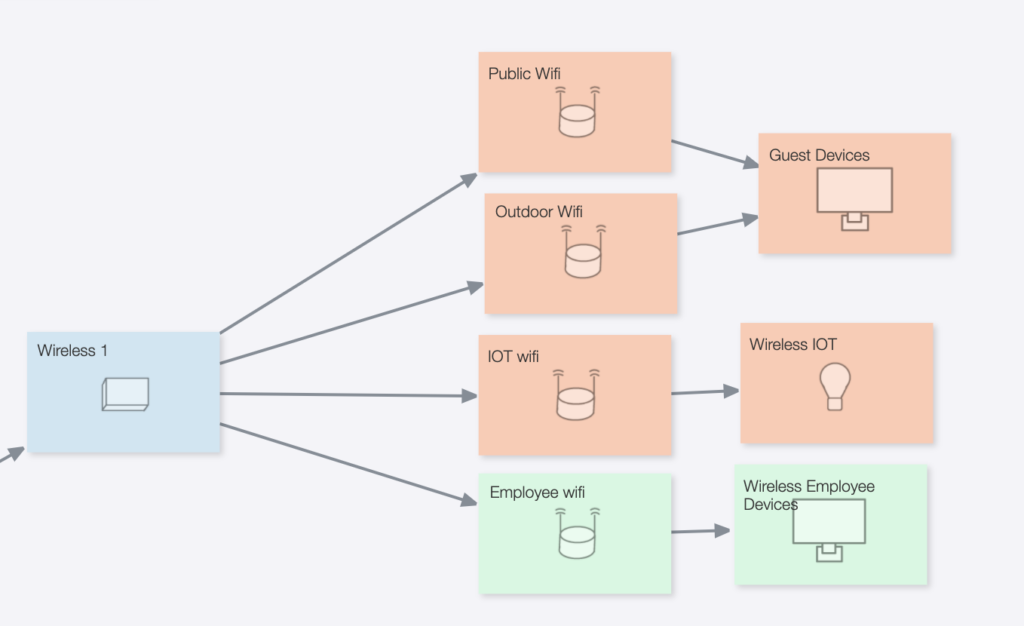
The last tip was color. Sam used card colors for device categories and security levels in the demo, and the same trick works for VLANs. In the close-up below, one wireless card fans out to public, outdoor, IoT, and employee networks, and the colors tell you how far to trust each one before you read a single label.
If you’d rather describe your network to an AI and start from a draft, our guide on how to make diagrams with AI covers what to ask for and how to get a draft worth keeping.
Didn’t find what you need? Visit our Help Center to find answers or get in contact with our team.
Ready to try CardBoard for yourself? Create a free account. Three boards, no credit card.